[[ Check out my Wordpress blog Context/Earth for environmental and energy topics tied together in a semantic web framework ]]

Monday, October 31, 2005

Morning Remembrance

obit


As Big Gav notes, we have lost a keen observer on energy issues, the Nobel-prize winning chemist Richard E. Smalley from Rice University. I had the honor of seeing Smalley speak as a conference key-note several years ago, and he stirred me to think about our energy predicament in a way that I hadn't since my teenage years in the late 70's. The fact that he recently had become one of the most articulate scientific spokesman for energy and water issues also boded well for our future. He may not have solved it with his proposals for a nanotechnology-based energy grid, but he sure could smell out the overly ripe ideas, from abiotic oil to tidal power.

If Smalley had a morbid sense of humor, he would probably appreciate this audio remembrance from Air America Radio's Morning Sedition [WMA]1. When I heard Smalley's name suddenly mentioned in this comedy bit, it shocked me quite a bit -- heightened by the fact that environmentalist Jim "Mort Mortenson" Earl doesn't joke about the identity of the person, only about the absurd process of dying. But then I thought about my own experiences in the materials science field. Not having a clue that Smalley had survived with a cancer diagnosis the last few years, it made sense in my probabilistic mind that if Smalley had to expire, then a mutagenic ending would seem most fitting. You see, as most everyone in the chemistry profession understands as tribal knowledge, chemists do not live as long as other scientists. All the bad chemicals they (ingest, sniff, absorb, spill) tend to accumulate over time. And if you happen to work in the semiconductor field, you have to deal with HF burns (a fellow student of mine had a nasty one the length of his arm) and the accidental inhaling of same. I had heard apocryphal horror stories such as the case of all the techs working at a state-of-the-art facility dying over the span of a few years. And then you had all the benzene and other solvents to deal with in the pre-EPA days. (Don't you know that since getting away from chemistry, I now happen to spend a lot of time sitting on top of a super-fund site.) Without knowing the exact cancer that befell Smalley, I have a feeling that he mixed a lot of bad stuff as a grad student and post-doc. It finally caught up to him.

Which gets us to Smalley's ballsy attitude. I like to think I can go after peak-oil optimists like Michael Lynch with just a dose of the courage that Smalley has mustered up the last few years. It helps to have a BS detector highly tuned thanks to witnessing the way top scientists have operated over the years.

Specifically, I called Lynch on his assertion of having an oil depletion model published in a "refereed" journal.
9. A simple supply model (and its shortcomings)
In theory, a bottom-up, microeconomic supply model can be developed with clear-cut dependent and explanatory variables: Price (or revenue) leads to exploration expenditures and thus drilling, which cause discoveries, discoveries are developed into capacity which is produced. Various factors such as cost and depletion modify the outcomes, but in theory, all of these would be amenable to simple econometric modeling (see Table 1). However, such a model has proved impossible to construct for a variety of reasons. -- "The Quarterly Review of Economics and Finance", 2002
Which clearly shows that he has no model. And then I learn the fact that his journal article came from a "boutique" publication that had a lifetime of a few years. Sure enough, it seemed to stop publishing in the year his article came out. Somebody has to stop Lynch from preaching this crap. But who will do it?

While in graduate school, I worked with a post-doc who got his Physics PhD from Rice U. Although he didn't work with Smalley directly, I remember him telling me how arrogantly Smalley acted as a research colleague and intimidating presence. In retrospect, I think this attitude had more to do with taking the research by the balls if you want to make your point, or at least make any progress.

So, why am I personally working on this oil depletion topic when I happen to have an advanced degree in a completely related field?

Better still -- Why did Professor Smalley give lectures in a field outside his area of expertise, with keynote addresses, hearings before congress, and his taking on a bunch of wild-eyed energy optimists, all the while trying to beat the cancer that had slowly eaten away at him the last few years? Why did he try to make us all aware of our dire energy predicament even though he could have rested on his Nobel prize laurels? Why did he urge everyone he ran across to help get young people interested in math and science, even though he remained a royal pain to deal with one-on-one on a technical level?

Because he probably gave a damn, that's why.

If that sounds pretentious, too bad. At least you know why some people don't care to suffer fools. That dude took no prisoners. Kurzweil and Drexler, that includes you as well. Sometime soon a progeny of Smalley, perhaps as Mortenson coined it, a nano-condensed Dick Tiny, will soon come after your reputation, because you guys have nothing else to offer.


1Morning Sedition is going through a possible death scene on its own, with angsty host Marc Maron apparently on his way out. Dang, double whammy.

Sunday, October 30, 2005

Meanderings

Big Gav demonstrates the effects of playing with nature in the southern hemisphere while Phila does the same service courtesy of the north.

In both cases, altering the environment leads to unintended consequences. In the southern hemisphere, deforestation along the Amazon River has likely exacerbated the effects of the current drought, causing much reduced flow along the river and in particular, its tributaries.

In the northern hemisphere, you first have to understand the history of direct manipulation of the flow of water by humans. Read Cadillac Desert by Marc Reisner for a good background. The developers considering redeveloping along the Salton Sea might want to pause and take a deep breath before getting their building permits.
In 1905, floodwaters caused a levee to break on the Colorado River near Yuma; water rushed into the Salton Basin. This created the Salton Sea, about 68 feet deep, 55 miles long, and 16 miles wide, with a total water area of some 300 sq. miles. Since the break threatened the agriculturally rich Imperial Valley and a major railroad route, the levee was finally repaired in 1907, but the Salton Sea remains.

Commerce & Politics
The Colorado is a remarkable source for hydroelectric power and irrigation. Of its 10 million potential horsepower, one-fifth has been developed. 21 dams have been built on the Colorado and its tributaries. The river rarely reaches the Gulf of California because of these dams. The Morelos Diversion Dam, located on the Mexico-Arizona border is the southernmost dam on the Colorado. It sends virtually all of the remaining water to irrigation canals in the Mexicali Valley and to the towns of Mexicali and Tijuana.
Interestingly, the breech of the levee, actually an irrigation diversion structure, has some similarities to what happened to New Orleans. Fortunately, a teeming metropolis didn't get built up in that area.

If the Amazon basin turns into a desert, expect a similar course of events. Humans will dam the river to water the crops, weird crap happens, a sequel to Chinatown gets made, etc. I can't imagine the mightiest river in the world reduced to a trickle before entering the ocean, but history shows it could happen.

I didn't mean to meander so much in articulating my thoughts in this post, but a good flow of water will do that -- gravity makes it so.

Saturday, October 29, 2005

Words-in-mouth disease

James Glassman from his Tech Central Station command post supervises the wingnut Intellectual Dishonesty department with his ability to put words in the mouth of a subject. Daniel Yergin, though a bit misguided himself, had the misfortune of getting PhotoShopped by TCS. In a few years, we will have a mordant chuckle over that image.

glAssman summarizes the interview he did with Yergin thusly:
As you can see, Dan Yergin is separating the myths from the reality. The political overreaction could actually be counterproductive when it comes to trying to solve the problems of energy. In fact, it's fairly straightforward -- the best way to get energy prices down is by increasing supply, to some extent reducing demand, which happens anyway in response to higher prices. But how do we increase supply? Not by political intervention. That disrupts capital markets, makes investors think, well, maybe putting money into energy companies is not the best use if there's going to be political repercussions to doing that. So, perhaps Speaker Hastert, Senator Lieberman, Senator Dorgan, and others who are responding in an earnest, and heartfelt way to the complaints of their constituents about higher oil and gas prices, are really doing exactly the wrong thing. We need to make markets work. That is Dan Yergin's advice. Sounds sound to me.
It serves Yergin right for consenting to an interview with TCS. Not that Yergin, himself doesn't lean right, but Glassman effectively inserted wingnut talking points where none existed. Shameful how he frames Yergin as advocating a stick-your-head-in-the-sand solution.

Friday, October 28, 2005

Secondary Peak

Health specialist Matt has resurfaced (in comments) and pointed out that we have averted a crisis in unnaturally elevated expectations. We have delayed Peak Ponies for awhile, at least.

The administration's dreams of a Myraq start to look more and more bleak. First, their "coalition of the willing" went splitsville, and now we may see the same for the "coalition of the inner circle". Take a look at this oldie-but-goodie ShockWave animation: George Double-Yooh and the Oil Tree (Courtesy of Air America Radio's Morning Sedition show).

Thursday, October 27, 2005

Abridged

Treasury Secretary Snow gave an online interview recently. I provide a Reader's Digest abridged edition:

Daniel, from Levittown writes:
Dear Mr. Snow -- I read on your web-site that "The American economy is the envy of the world." My wife and I are both teachers and we are expecting our first child in May. My concern is that I have read many reports that a recesion in right around the corner and that school districts will be forced to lay of teachers. Is the Bush ecomomic plan have any provisions that will keep this from happening. Thank you for our service to our country.

John Snow
Hello, Spaniel, and thank you for writing in with your story and this very important question. There is flatly no reason to be worried about a national economic recession in the near future, and I hope I can put your worries to rest.
...


Hector, from Chicago writes:
Is there a way to lower natural gas and oil prices? How do we do it? Can we maybe provide more incenitives for oil producers so they give us cheaper gas? Is there a way to decrese the ballooning deficit in the next few years?

John Snow
Hello, Rectum, thanks for these good questions. The energy bill that the President signed this summer made an unprecedented commitment to energy conservation, improved production and efficiency as well as the development of alternative and renewable energy sources such as ethanol and biodiesel fuel. All of these things, over the long term, should help us reduce our dependency on expensive foreign oil. The energy bill was an important first step toward a more affordable and reliable supply of energy for American consumers.
...


David, from Rockledge Fl writes:
What short and long term effects could implementing a Flat Tax have on the overall Economy.

John Snow
Your question is very timely, Devil! There is a lot of interest in simplifying our tax code, and the President appointed a panel earlier this year to delve into this issue.
...


Jon, from NY, NY writes:
Why am I still left thinking there never was a social security crisis?

John Snow
Well, Joan, that's because the crisis is in the future -- the President brought Social Security to the forefront of the Washington, DC policy agenda because there is a very serious looming crisis for the system.
...


Brady, from tennessee writes:
Dear Sir, why do you continue to allow the dollar to be devalued? If the dollar is high than gasoline and other products are cheaper..I know the obvious answer is the trade deficit will be lower because our products overseas are cheaper. It does not matter. we will always have a trade deficit big or small..I suggest increasing the value of the dollar to make gas cheaper here.

John Snow
Brainy, we believe that a strong dollar is in America's national interest. This is a policy that we have had for some time and continue to support.
...


Tom, from Dallas writes:
What does the Administration plan to do about the trade deficit? Do you believe the terms of trade must improve. Would solving the energy problem and improving domestic auto prodution help. What are some of the other solutions to conundrum?

John Snow
Hi, Tomb, thanks for writing in today. We are working steadily with our trading partners on this issue. The most important factor leading to our trade deficit is that the U.S. economy has had much higher rates of economic growth ad job creation than our major trading partners over the past decade. In an open economy, like the United States, this means that we have more wealth and freedom to buy products from all over the world -- and Americans use a higher proportion of that wealth and freedom to purchase imports. Our major trading partners -- Japan and Europe in particular -- have grown slowly or not at all for much of the past decade, and their economies are not as open to imports as is the United States. Our trading partners have a responsibility to put in place pro-growth policies that will lead to strong growth and therefore enable them to purchase more goods and services from American producers, which will help bring trade more into balance.
...


Kristina, from Loretto, PA writes:
Secretary Snow,Is there a real estate bubble in the economy right now?


Thanks KrispyKreme

John Snow
While we should always be on guard for "bubbles" or areas where economic activity doesn't correspond with underlying economic fundamentals -- as was the case with stock market bubble of the late 1990s.
...


Taylor, from Kentucky writes:
what is it like being secretary of the treasury,also working for thepresident?

John Snow
Thanks for writing today, Trailer. Being Treasury Secretary is a truly great honor.
...


jaxon, from sherman oaks, ca writes:
who decides which figure's picture goes on the money

John Snow
Hello, Jockson, thanks for this question. There are a lot of interesting facts about our nation's currency that might interest you at www.moneyfactory.gov -- I encourage you to check it out.
...


adam, from studio city writes:
why did you take away the two dollar bill?

John Snow
Thanks for this interesting question, Adman. But actually, the $2 note hasn't gone away at all.
...


Cliff, from Brimfield, Ohio writes:
Secretary Snow: What affect has mother nature done to the United States Treasury as a result of all these hurricanes? Short term and Long term.
Thank You

John Snow
Thanks for this important question, Spliff. It's great to hear from a fellow Buckeye.
...


John, from Texas writes:
What the excuse for allowing US corporations to cheat on their taxes by having offshore tax havens?

John Snow
Everyone should pay their fair share of taxes. When anyone breaks the law to avoid paying taxes it hurts all of us. Rest assured that the Treasury Department is committed to enforcing penalties for tax evasion.
...


Emily, from Woodlake CA. writes:
I've heard that the economy is falling but to me it seems to be raising.
Is that true? Thanks "Emmy"

John Snow
Hi, Enema, and thanks for writing in with this important question. The U.S. economy has endured a number of shocks in recent years, and I know that can be worrisome, but the good news is that we've not only survived these shocks, we've recovered wonderfully and our economy is the largest, strongest and most resilient in the world.
...


Jacques, from Baltimore, Maryland
writes:
Mr.Secretary,First and foremost, I'd like to thank you for taking the time out of your busy schedule to discuss the economy with the american people. This is a vital discussion at a crucial time. I have three questions for you. What are some of the positive actions the Bush administration is taking to strenghten our economy in 2006. Some have argued that the budget deficit (National Debt) and the ongoing war in Iraq have adversely impacted the economy. What's your take on that? Do you see a more vibrant economy in the upcoming year. The president had promised to cut the budget deficit in half in five years. Do you think that's feasible?
I look foward to your reply.
Once again, thanks for discussing the state of the economy with us.

John Snow
Thank you for writing in today, Jockstrap. All of your questions are good!
...


Jessica, from Gardner, MA writes:
I would like to know why the government is so insistant that the economy is fine? Gas, heating oil and electric prices are outrageous, there is no enforcement on cost of living raises and there is NO extra money.
Please explain to me on how the economy is "strong". Thank you

John Snow
Hi, Dessicant, thanks for participating in "Ask the White House!" My answer to Enema's question, earlier, addressed a lot of your concerns about the economy (which is doing very well -- growing and creating jobs at a terrific rate), but I do want to address your concern about energy costs.
...


daniel, from westport, ct
writes:
Can you tell me how much of the excess Social Security payroll taxes -- payroll taxes collected by the government but not spent on benefits -- have been spent on government operations in the past five fiscal years?
And if Social Security is facing a crisis, why were those funds spent on government operations?

John Snow
Thanks for this terrific question, Damnyou. The total amount of Social Security surpluses that have been spent on other programs is at $1.7 trillion today.
...


shirley, from ohio writes:
a lot of us voters believe Greenspan is hurting the ecomomy with interest hikes. President Bush nominates another man who says he'll continue Greenspan's policy of hiking interest rates. how are we failing to see that interest rate hikes are helping the economy?

John Snow
Greetings to my fellow Buckeye, Churlish. Thanks for your question.
...


Kate, from Ohio writes:
We are all lulled into a false sense of security and most of us are shielded from the truth about the economy. Why doesn't the administration tell the people the truth, don't we all deserve that?
Isn't that part of the American Dream that millions of people strive to accomplish? The purpose of the government is to keep us, the people, informed, is it really that hard to just tell us the truth even if it is not what we want to hear?

John Snow
Thanks for joining us on "Ask the White House" today, Kite. Don't forget that America also has the largest economy in the world and deficits as a percentage of GDP is the more important measure.
...


Daniel, from Lakeville, CT writes:
How much impact will the many hurricanes this season have on economic growth? Thank you.

John Snow
As I mentioned to Spliff earlier, the storms likely took away from economic wealth in the third quarter, and we've already seen the impact in terms of lost jobs, but I am optimistic that rebuilding efforts will restore lost GDP by the first quarter of next year.
...


John Snow

Thanks to everyone for all these wonderful questions. It's always a pleasure to be on "Ask the White House" and I look forward to our next online discussion!
It really doesn't matter if you read the actual "complete" answers. Predictable answers all. Apologies to Scott Adams and Dogbert.

Wednesday, October 26, 2005

The Scorpion's Gate

Government security expert Richard Clarke has a new book out. From his appearance on Air America Radio's Majority Report with Sam Seder, it appears that he intended it as a work of fiction set in the near future, but set off cautionary alarms as to what will likely happen in the next five years. One thrust of the book deals with China's increasing thirst for oil and how we will soon fight for table scraps in the Middle East.
It's 2010, and the newly established Republic of Islamyah;the former Saudi Arabia;is trying to destabilize Bahrain: the Diplomat Hotel has been bombed, and, as the first chapter of this intense debut thriller closes, the Crowne Plaza is "pancaking." Meanwhile, the deposed House of Saud is holed up in Houston; the Chinese are providing arms and training to Islamyah; the Iranians have the bomb. Secretary of Defense Henry Conrad thinks the time is ripe to invade Islamyah and seize its oil, for which the U.S. is locked in deadly competition with China. Cooler heads in the U.S. (and British) hierarchies are very, very alarmed. Sound familiar? Clarke's Against All Enemies delivered an apostate critique of the Bush administration's counterterrorism efforts, along with a vision of the future very much like today. The writing's nothing special; what is special is Clarke's passionate and deftly detailed version of the present, albeit one told in terms of its consequences. It's a brilliant conceit, and though it's sometimes drowned out by the din of various axes being ground ("It's 68 degrees [in Washington]on January 28 and the White House still claims that global warming isn't a problem?"), the story is crowded with terrific double crosses, defections and deceptions. They're icing, though: Clarke's dramatic micro explanations of how things "really" work; from a hand who served Nixon, Reagan, Clinton and both Bushes; are the true story. This is the first novel to shift all the way from Clancy's Cold War to the present war on terror.

Also at AAR, Al Franken's "The Truth (with jokes)" came out at #2 on Amazon. Check out the mockingly funny ad at the site featuring some of Al's colleagues meting out punishment (Ben Wikler yielding the bottle). But what may prove most funny, that Scott "SmallTrunk" Johnson at Powerline thinks the object of the pummelling, one "Scott from Colorado", refers to his own self. A really sad case of projection.


Scott Adams on Intelligent Design: Each of you is so intelligently designed that you can survive a Category 5 hurricane via a process known as running away.

Tuesday, October 25, 2005

Stalag FoxNews

Climate change reporting has scraped the bottom of the barrel as Bill O'Reilly of FoxNews gives his take on global warming:
O'REILLY: This has been the worst hurricane year on record. 23 storms. Of course, we all remember the tsunami last Christmas and some climatologists are very worried the planet is vulnerable to even more violent weather. With us now is Jess (sic) Schultz, Chief Climatologist with Weather 2000, a consulting firm her in New York City. You heard Bernie Rayno (of Accuweather) say 15 more years of intense weather. Is that your outlook as well?

SCHULTZ: Yes. We're actually in the middle or getting somewhat into an active phase of this ocean conveyor belt system, what we call the thermohaline system and what happens is it grows stronger for about 30 years and that transports all sorts of heat and energy and moisture to different areas, which can, in turn, increase the frequency and intensity of hurricanes and it can do a lot of other things as well.
The NewsHounds site lists this Jeff Schultz character as part of a consulting outfit called Weather 2000 "that specializes in creating a comfort zone for corporations that wish to ignore or deny the science behind global warming". Sen. Rick Santorum has pushed private firms such as Weather 2000 recently, going so far as to suggesting the dismantling of the National Weather Service in favor of the commercial outfits -- mostly in favor of those who happen to contribute to the Rethuglican's coffers. O'Reilly's namedropping of Accuweather fingers the offending party.

But really, what kind of earth scientist would sit there and not have his explode in laughter upon hearing someone blame an eathquake-induced tsunami on the weather. But I imagine this idiot Schultz has no trouble suppressing himself from saying the partisan talk-show equivalent of career suicide. When in doubt, the paid-off consultants can fall back on the old reliable:

Monday, October 24, 2005

Hubbert did in the Soviet Union?

A commenter at TOD provided a link to lecture notes by Ayres on Economic Growth (and Cheap Oil)
It seems that the CIA took Hubbert’s methodology seriously and applied it to the USSR (Anonymous 1977). This report predicted that Soviet oil production would peak in the early 1980's. In fact there were two peaks, the first in 1983, at 12.5 million barrels per day and the second in 1988 at 12.6 barrels per day. Since then production has declined steadily. It seems likely that the Reagan administration, which took office in 1981, bearing in mind the economic havoc produced when US production peaked in 1981, followed by the Arab oil embargo and the "oil crisis" of 1973-74 and the deep recession that followed, decided to use the "oil weapon" to destabilize the USSR. Reagan embarked on a major military buildup, putting the Soviet Union under pressure to keep up. Meanwhile, declining prices after 1981 forced the USSR to pump more oil to supply its clients in Eastern Europe and to sell in world markets for hard currency. Then in 1985 Regan persuaded Saudi Arabia to flood the world markets with cheap oil. Again, the USSR had to increase output to earn hard currency. This led to the second peak in 1988. Two years later the USSR imploded (Heinberg 2004) pp 40-41.
I have a feeling that the implosion caused a reverse shock which has since stabilized. I would try to fit this curve with the oil shock model if I could, but I have yet to find a good set of discovery data.

Which brings us to asking an exceedingly pretentious question: Can we generate a better model than the logistic curve, donate it to the CIA, and thus help them out in putting an end to oil-funded terrorism?

Nah! Let's use it to make a killing in the oil future's market instead!

Saturday, October 22, 2005

Oil Depletion Model posts

Go to this page for an update.

Commie Pinko Bay Watch

Purported right-wing military blogger, Austin Bay, advocates socialism to redistribute wealth in Iraq.
Iraq, long plundered by despots, should be a wealthy country. It has water, an agricultural base, a source of capital (oil) and people willing to work. It is the best place to begin to reform the dysfunctional political systems that shackle and rob the vast majority of Middle Easterners. Success in Iraq would create conditions to break the region's endless cycle of robbery and violence. It would also force angry Middle Eastern Muslims to finally confront the inadequacies of their own societies, instead of blaming Europe, the United States and Israel for their centuries of fossilization and decline.

Success in Iraq means spreading wealth and curbing corruption. Iraq desperately needs to become an ownership society, for economic stakeholders are political stakeholders.
Invariably, "Spreading the wealth" serve as codewords among the wingnut fringe to indicate a cliched progressive slant on things. Bay appears to have come out -- "not that there is anything wrong with that." :
Well said. The Iraqi people need to put an oil trust referendum on their next national ballot.
Perhaps Bay has spent some time researching other socialist economies. I imagine Hugo Chavez's recent views about the future of the world's oil economy may also soon resonate with Colonel Bay (ret.).
Chavez [audio transcribed]: We have to use oil in a rational manner. We're asking people to use oil rationally and we are taking measures in Venezuela. For instance, now we are producing green gasoline, we no longer have leaded gasoline. I'm asking the rest of the world to do the same. We're interested for instance in alternative sources of energy, such as wind and solar sources; the peaceful uses of nuclear. We need to be rational in sources of energy. We're in a large debate on the energy crisis to stop consumption.


The proposed title for Bay's next little toy video wargame:
Comrades in Arms: Workers Control the Means of Production


Oh yeah, Def'n: a miserable failure: George W. Bush, George Bush, George Walker Bush.

Too Starchy

This does not need much explanation; from Policy Pete (who doesn't use permalinks):

Friday, October 21, 2005

"The mind is a terrible thing to lose"

Bob Park reminds us from where the administration's strange thoughts regarding space exploration originally sprung1 from. About 16 years ago, Professor Park emailed list subscribers a monospaced version of this newsletter:

That nutty remark probably put an end to the National Space(y) Council.

And moreover:
3. SPACE RACE: SO WENT THE LAST ISLAND OF SANITY IN A CRAZY WORLD
Who would have believed that the United States, having landed men on the Moon 36 years ago in a race with the Soviet Union, and having spent more than $600B on its space program, would today be locked in another race to send humans to the Moon? A race with China? And China may be ahead? Go on! Now suppose I told you that the United Kingdom, long admired by scientists for staying clear of the ISS, is urged by a commission of the Royal Astronomical Society to enter the race? "Say it ain't so, Joe."
Neons2 such as Matt Drudge believe that the Chinese staged the recent space shot, and that it had Photoshop written all over it. I rate the movie Capricorn One as one of my not-so-guilty all-time favorites, but I beg to differ on what the Chinese have probably accomplished. Lots of these scenes come out of 3-D visualization software simulations -- an absolute must for getting it right the first time. Secondly, I have recently heard rumors that the Chinese military technology can basically make hay with all of the West's satellite and communications infrastructure using a mix of state-of-the-art laser technology and other electro-optical info-weapons. Nothing to sneer at, and plus these things probably make great potatoe pumpkin shooters.

While the clueless complain about our left-leaning educational system, and right-wing imbeciles like Quayle and Bush slide through, the average intelligence of the world's population keeps on increasing. The scientists and technologists overseas look with bewilderment at our infatuation with Intelligent Design. No wonder we lost the National Space Council and gained the Institutes of Discovery and Hindsight Foresight.

As science education drives the standard-of-living, so too does a country's standard-of-living drive its energy use, and I think our respective countries' technology tracks have either started to diverge or to narrow. I don't think it matters all that much which way it turns out. Either way, the spreading of wealth means that the race to the bottom will start before we know what hit us.


1What a waste it is to lose one's mind or not to have a mind is very wasteful. --; Dan Quayle
2A dim-bulb follower of the neo-con movement.

The images on Drudge's site don't stay around long. I wonder why? Archived here.

Thursday, October 20, 2005

Blowdown

Last month, I suffered the after-effects of a potent late-summer thunderstorm, with winds approaching derecho ferocity. The outcome of the storm left me without electrical power for about 5 days (no big whoop -- personally, I discovered that I used my refrigerator more to prevent gypsy moths from infesting my grain pantry than anything else). The storm also blew part of the roof off where I work. Some of the local broadcasters got so worked up over the damage that they said stuff to the effect, "this storm has changed the arboreal landscape of the northern metro". I have lots of trees, almost all of them oak, and nothing got blown down. On the other hand, the storm leveled many of the trees in open spaces, a side-effect of not having the benefit of a natural wind-break baffle.

But in retrospect, last month's storm seemed inconsequential to a storm that swept through the Boundary Waters Canoe Area (BWCA) wilderness of northern Minnesota in 1999.

Ottmar had never seen anything like it. Trees were flattened for miles. Many had been snapped off 20 feet high. Dead wood formed a tangled, well-ventilated mat so thick a person could stand on a horizontal trunk and still be 12 feet above the ground. His team had to crawl, climb, and duck, with clipboards in hand, to cover the few acres they needed for their survey.
I haven't visited that area since the blowdown, but I have crossed man-made clear-cut tangles in the BWCA and can't even imagine the devastation that that particular storm caused. Pictures don't do it justice, because the effects go beyond the camera's horizon. Similar to a huge forest fire (which could still happen, given the amount of timber tinder remaining 6 years later). And as I recall, the storm knocked down quite a few state-record trees, including the tallest white pine.

Percentage of trees blown down in Superior National Forest in northeastern Minnesota on July 4, 1999.


A lodge owner watched as his lawn chairs flew across the lawn "like little missiles." Canoes and boats were blown into the air, followed by boat docks and boat houses. Trees were sheared in half, uprooted, tossed in heaps. "They looked like pixie sticks; they were scattered every which way." Although the storm lasted no more than 20 minutes, it managed in that brief time to knock down more than 25 million trees, flattening a path 20 kilometers wide and 60 kilometers long.

And to think that this storm had nothing to do with global warming or climate change in general. But the old-growth conifers of the BWCA may not come back as the prime canopy.
And there's more. Frelich says red maples are appearing in the newly opened forest - where they wouldn't have survived just a few decades ago. They're here, he says, because winters aren't as cold as they used to be. And, while blowdowns are natural, it's conceivable that increasingly warm and humid weather will generate more of the strong thunderstorms that flatten timber.

If global warming is behind this, more blowdowns may be in the future. And with hardwoods like maple creeping in, the future north woods might look a lot different than it used too. The 1999 blowdown could be just the beginning.

Other sites with interesting pictures:
Science Museum of Minnesota
Minnesota DNR
NOAA

Wednesday, October 19, 2005

The Causality Hoax and Peak Ponies

The rhetorical tricks of Intelligent Design have entered into the Peak Oil discussion sphere. In particular, I have noticed that some of the strongest oil depletion cynics have started to argue in terms of causality, and how causality prevents us from predicting peak oil with any credibility at all. I can just imagine the governors of the Discovery Institute appreciating the essential misguided beauty of the causality argument. Like the rationale behind Intelligent Design, causality hypes up the imponderables at the expense of science and math.

I don't particularly understand the roots of the argument, a malady brought about by way too much logical dissonance, but I think I can relate it briefly:

Peak Oil models violate causality: No one knows the ultimate cause of oil production, therefore all models that purport to equate cause with effect suffer from a fatal flaw. Nobody knows what riches lie below the surface of the earth; to assert otherwise produces an effect without a cause.

It leads to statements such as this from Michael Lynch:
They have repeatedly misinterpreted political and economic effects as reflecting geological constraints, and misunderstood the causality underlying exploration, discovery and production.
The layman's definition of causality derives from observations of cause and effect. Or nothing can occur without a cause. I take an even more basic view of things; you can only violate causality if given access to a time machine or by occupying a niche within the quantum world. However, the causality police don't reason that way. Instead they prefer to believe in black and white, either we have no oil to speak of (i.e. the endgame rhapsody, see Example 1) or, more likely, untold riches. Why? Because you, oh pathetic modeller, cannot prove otherwise! As a corollary, they lay no credence to a Bayesian belief structure. It does not matter that the inhabitants of this planet have discovered most of the oil we will ever find already, resulting in a discovery peak several decades ago.
Lynch: The argument that the drop in global discoveries proves scarcity of the resource is the best example of the importance of understanding causality. While it is true that global oil discoveries dropped in the 1970s from the previous rate, this was largely due to a drop in exploration in the Middle East. Governments nationalized foreign operations and cut back drilling as demand for their oil fell by half, leaving them with an enormous surplus of unexploited reserves. It is noteworthy that none of those pessimistic about oil resources show discovery over time by region, which would support this.

See what I mean? Evidently, preponderance of evidence arguments get trumped by talking points of the oiligarchy fueled by unbridled optimism. Everyone, including both members of the left and the right, wants their very own brand new pony. Unfortunately, we will likely hit Peak Pony soon and have to deal with the consequences:
Experts Warn of "Peak Pony"
Posted by The Editors under Uncategorized

WASHINGTON (Reuters) - Republicans have had it tough over the last few weeks, with President Bush approval ratings below 40%, the indictment of House Majority Leader Tom DeLay on conspiracy and money laundering charges, and the expected indictment of several senior White House officials for blowing the cover of a CIA operative. Republican woes have been a boon for the pony markets, which have seen prices soar to historic highs due to increased demand from ecstatic liberals. This spike in demand has led many experts to warn of a near-term pony shortage, and led to fears that the world may be approaching "Peak Pony", the point at which nations are no longer able to meet their vital pony needs.

For most of the 20th century, ponies were primarily used as imaginary companions for giggling pre-teen girls. However, the market base for ponies has expanded considerably in recent weeks and months, as liberal euphoria has reached such giddy heights that only brightly-colored, silken-maned, magical sparkly friendly talking flying ponies are capable of expressing.


The oil shock model does not violate the rules of causality. We have a finite supply of oil in the world. An undebateable fact. Humans discover the oil, providing both a stimulus and a cause for extraction. The trends show what we should expect given all prior information. The short-term promise of ponies for everyone notwithstanding, we have to think beyond political gratification and wrestle with the real issues.


Example 1:
Cause
- God loves you! Deal with it.
Effect
- We'll leave the lights on for you ... in hell.

Monday, October 17, 2005

Oil production ramp-up times

Interesting data from a poster named Taskforce_Unity on the PeakOil.Com site.:
Average field distribution from 100 projects announced to be taken on-stream between the period 2005-2010 (taken from my own report, launch date now set at the end of October due to media-related reasons).


This analysis showed that:

• 23% of the projects were EOR projects (ed: ennhanced oil recovery)
• 12% of the projects were discovered before 1980
• 7% of the projects were discovered between 1980 and 1989
• 29% of the projects were discovered between 1990 and 1999
• 18% of the projects were discovered between 2000 and 2004
• 11% of the projects were unconventional projects (tar sands and orinoco heavy oil)

This kind of data helps calibrate predictions as it includes estimates of the rolled up average value for how long a field stays in the fallow + development phases from the shock model. Not extremely revelatory at the moment, but it does show the significant average lag and fairly wide stochastic distribution about the mean that I used in fits to global production data. Khebab noted that these appeared to follow a Gamma law (sic) distribution. In fact, the gamma distribution follows from the convolution of two or more exponentials, which in fact matches at least the first two of the three exponential phases, Fallow, Development, and Maturation, that the shock model required as parametric inputs.

Gamma distributions of various orders

Sunday, October 16, 2005

Wonks on The Economy and The Climate

Hale Stewart at BOPNews tries his hand at screaming at thick-headed market analysts (i.e. Larry "I just say what they tell me to say" Kudlow):
However -- for anyone that has been paying attention to the markets, Larry (don’t you always say you trust the market to do the right thing? Then why the hell aren’t you looking at any of the energy charts?) you will notice a pattern in energy prices: they are increasing really fast. Prices are in what is referred to as an uptrend. These aren’t 4-5% increases, Larry. These are really big price moves.

Now, I have an idea, Larry. Why don’t we find a substitute for oil that we can use instead – something cheaper. I’m waiting Larry. I’m still waiting Larry. Can’t find something to use instead, Larry? THAT’S BECAUSE THERE ARE NO SUBSTITUTES FOR OIL, LARRY. DUH!!!!!!! – YOU JACKASS.
His original emphasis.

Newberry also has a rather interesting yet oblique post on climate change and how policy wonks, game theorists, and other non-scientists have apparently taken the lead on predicting a future that has arrived in everyone's minds but their own. I started watching the CATO Institute's video on Global Warming: The State of the Debate, and though I didn't finish, my first impression suggests that, yes indeed, these people only approximate scientists.

Conclusion: No substitutes for oil. And no one has found a substitute for science, either.


Update: For other economic analyses, Big Gav points to Puplava's Financial Sense (synopsis: no Plan B) and Jerome provides a rather bleak roundup.

Friday, October 14, 2005

Rifkin, survivor

First Jimmy Carter makes a resurgence in the editorial pages for his prescient thinking, now Jeremy Rifkin gets his turn to remind us of what he wrote several decades ago -- without rubbing it in at all. And if the pundits and right wingers do get started on his case (according to Time Magazine, "the most hated man in science"), let's remind them of his relative accuracy along the timeline of history.

U.S. lower-48 oil production -- year 0 to 2005 A.D.


See the 1970's there? That includes disco, Nixon, pet rocks, punk rocks, the all-time best movies, and Carter and Rifkin and Erhlich. And Erhlich's chief critic back then, Julian Simon, remains a footnote in history.
Today, many of Julian Simon’s views on population and natural resources are so triumphant that they are almost mainstream. No one can rationally look at the evidence today and still claim, for example, that we are running out of food or energy. But those who did not know Julian or of his writings in the 1970s and early 1980s cannot fully appreciate how viciously he was attacked—from both the left and the right. Paul Ehrlich once snarled that Simon’s writings proved that "the one thing the earth will never run out of is imbeciles." A famous professor at the University of Wisconsin wrote, "Julian Simon could be dismissed as a simpleminded nut case, if his ideas weren’t so dangerous."

To this day I remain convinced that the endless ad hominem attacks were a result of the fact that—try as they would—Simon’s critics never once succeeded in puncturing holes in his data or his theories. What ultimately vindicated his theories was that the doomsayers’ predictions of global famine, $100 a barrel oil, nuclear winter, catastrophic depletion of the ozone layer, falling living standards, and so on were all discredited by events. For example, the year 2000 is almost upon us, and we can now see that the direction in which virtually every trend of human welfare has moved has been precisely the opposite of that predicted by Global 2000. By now Simon and Kahn’s contrarian conclusions in The Resourceful Earth look amazingly prescient.


Thanks to Big Gav for the link.

Thursday, October 13, 2005

The mind is a terrible thing to decline

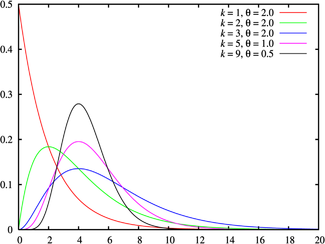
The upward glitch in the BP global oil production levels the past couple of years has a few people very concerned about massive book cooking. At PeakOil.com, a poster provided an interesting quote from a Matt Simmon's presentation from last year:
The single best data we get on OPEC oil production, the first source of media, comes from a fabulous firm called Petrologistics in Geneva, Switzerland. In case none of you have ever been to the offices of Petrologistics -- I haven't, I've just heard a lot about it -- it's a one-man show over a grocery store in Geneva. Conrad Gerber. I think it's basically a scam. He's frontrunning for somebody [inaudible] because there is no way on earth that anybody could be over a grocery store in Geneva and say, "Saudi Arabia is now producing..." But the fact that everybody has been so clammed up on their own information, we've left the world held hostage to Conrad Gerber's [inaudible] eye ... is itself alarming.
Note the sarcasm concerning the "fabulous firm". But the BP data also does show a rise in Former Soviet Union (FSU) numbers as commenter TI reminds us:
This is important because on world scale we might have a similar situation. The oil supply increased exceptionally during 2003 - 2004. Did OPEC countries use up there spare capacity and was Russia overproducing? The oil markets seem to show that there really is not much spare capacity left.
I repeat the numbers below, which show the FSU increasing at a perhaps unsustainable 10% per year, while OPEC showed a fairly significant increase of 7% in one year:

2000 2001 2002 2003 2004
---------------------------------------
31354 30628 28855 30686 32927 OPEC
35583 35541 36056 35870 35916 Non-OPEC
08013 08659 09533 10499 11417 FSU
---------------------------------------
74950 74828 74443 77054 80260 Total

Many people want to put price into the oil depletion model. In my mind, I have no problem conceptually adding a profit factor to a model to trend it the right way. Maintaining profit for the North Sea oil companies has to exert a huge influence in their desire to keep the production levels at a constant rate in the face of declining reserves. This may in fact help explain how the North Sea shoulder turns into a bump at the same level as the previous peak. The reverse shock of increasing extraction rate economically acts as a short-term profit maintainer, at the expense of a long-term economic outlook.


==>


The WSJ does not believe in peak oil: The Oil Bubble

But then again, neither does the gearhead crowd: Sustainable Abiotic Oil vs Peak Oil

In particular, keep your eye on:
Myron Ebell, an environmental analyst at the Competitive Enterprise Institute, notes that roughly 90% of the oil on the planet rests under government-owned land and these resources are abysmally managed.
Ebell has appeared with some regularity on Air America Radio and has gotten shredded by the likes of Thom Hartmann and Betsy Rosenberg as well as by the team at DemocracyNow!. But like a good foot soldier he remains mind-numbingly stoic in the face of reason. Either that, or as an alternative, his employers at the CEI will tell him to go packing. In other words, he has to keep his own profit margin up despite the inexorable momentum of the inevitable truth. Sad to say, but Ebell only has his short-term economic interests in mind.

Wednesday, October 12, 2005

So I picked up a sandwich I saw on the sidewalk and ate it.

Big Gav pointed out the latest Anti-Chomsky readings and so provided me with a compendium of every third-rate conspiracy theory that Mr. Chomsky has dismissively and probably rightly ignored. Apart from the faked moon landing, the face on Mars, and a few Weekly World News items, the author, Daniel Abrahamson, covers every discarded sandwich on the sidewalk. I think Chomsky sets off most people when, during a speech, he casually leads with a remark like "anybody that has spent 5 minutes looking into this can clearly see". He clearly irritates the gullible. Did you know that the most recent edition of the Merriam-Webster dictionary does not include the word gullible?
This document was discovered in the National Archives and has been the subject of mainstream articles by ABCNEWS and others. It stands as clear evidence that the U.S. government has designed plans to engineer terrorist attacks and blame them on foreign enemies. Yet Noam Chomsky does not think the Northwoods document matters:
ABC News as a paragon of objectivity and the second coming of Thomas Paine! To take a simple reality check of the current SCLM media situation, I don't think Chomsky has appeared on network television since the Dick Cavett or Tom Snyder days.

In the end, after reading the diatribe, Chomsky sounds more reasonable than ever. To whit, he wrote this blog item over a year ago that I also remember posting on:
Chomsky posted an entry called "Peak Oil" on his blog in June, 2004, writing the following: "The basic theory is incontrovertible. The only questions have to do with timing and cost."

I agree, we have other things to worry about than a New World Order created by either the Bilderberg group, the Council of Foreign Relations, the Trilateral Commission, the Free Masons, the United Nations, the Rockefeller Foundation, the Club of Rome, the Sierra Club (!), or whatever they call a meeting of more than two billionaires at a time.

Tuesday, October 11, 2005

UK North Sea simulation

At the request of a previous commenter, I took a stab at fitting the UK North Sea oil production data to the oil shock model. I transcribed the Laherrere data for discovery and production from the figure below:

The first cut I took assumed an immediate 4 year minimum time to construct an offshore oil platform with an exponential distribution of 1 year mean beyond that. The averages for the fallow phase and the maturation phase came out similarly low at 1 year. (Note that this differs for the worldwide fit where I assumed exponentials of 8 years for each of the fallow, construction, and maturation phases). I chose an extraction rate much closer to the world-wide average I used twice before of 0.07, adjusting it upward slightly to 0.1, i.e. 10% per year volume extracted. The unshocked results came out as the red curve below:


Note that a perceptible shoulder creeps up, largely due to the second set of discoveries. Importantly, the model can predict these secondary bumps given that the spacing between significant discoveries has a time gap beyond the reciprocal of the extraction rate.

Assuming naively that the model could account for the rest of the deviations through perturbations to the extraction rate, I eyeballed a shock profile duplicated to the right. I placed one regular shock causing a dip of 10% to the extraction rate in 1988; this corresponded to the devastating offshore fire on the Piper Alpha platform. After settling back to 10% extraction rate, I placed a fairly significant linearly increasing reverse shock starting in 1994. Whether this has any basis in reality, I can't really say for sure, but I needed this for the model to match the trending of the production curve.


So is this reverse shock indicative of a need to keep up with production demands? Or should we agree with Michael Lynch who keeps crowing up the second North Sea bump as the repudiation and comeuppance of every peak oil analyst out there?

Monday, October 10, 2005

Carter's brave vision on energy

From the Mpls StarTribune:
George W. Bush asking Americans to save oil by driving less reminds me of Jimmy Carter wearing a cardigan sweater and asking Americans to save oil by turning down our thermostats and, yes, by driving less.

But former President Carter was asking for individual sacrifice as a small part of an aggressive, national campaign. President Bush is asking for individual sacrifice instead of a national initiative.

Carter gave his first energy speech in February 1977. In July 1979, four months before Americans were taken hostage in Iran, he delivered his fifth energy address. To this day, that speech and its aftermath illuminate the profound differences between the way Democrats and Republicans address the oil crisis.

"Ten days ago I had planned to speak to you again about a very important subject -- energy," Carter began. "But as I was preparing to speak, I began to ask myself the same question that I now know has been troubling many of you. Why have we not been able to get together as a nation to resolve our serious energy problem?"

He told us he had set his speech aside and talked to hundreds of individuals. His conclusion? Americans had lost confidence in our capacity to act decisively and collectively to address and solve our problems. Republicans quickly dubbed the address the "malaise speech."

But to Carter the energy crisis offered an opportunity to regain our sense of hopefulness and national self-confidence. "Energy will be the immediate test of our ability to unite this nation, and it can also be the standard around which we rally," he observed. "On the battlefield of energy we can win for our nation a new confidence, and we can seize control again of our common destiny ... . It can rekindle our sense of unity, our confidence in the future, and give our nation and all of us individually a new sense of purpose."

Carter established a clear goal. "Beginning this moment, this nation will never use more foreign oil than we did in 1977 -- never. From now on, every new addition to our demand for energy will be met from our own production and our own conservation." By the end of the 1980s, the nation would reduce "our dependence on foreign oil by one-half."

To achieve these goals Carter requested of Congress "the most massive peacetime commitment of funds and resources in our nation's history to develop America's own alternative sources of fuel -- from coal, from oil shale, from plant products for gasohol, from unconventional gas, from the sun."

For Carter, fairness was to be an important criterion in shaping energy policy. Since the poor suffer most from rising energy prices, "Our nation must be fair to the poorest among us, so we will increase aid to needy Americans to cope with rising energy prices ... ."

Carter also applied the principle to the other end of the wealth spectrum: the oil companies reaping enormous profits because of OPEC-inspired price hikes.

"Congress must enact the windfall profits tax without delay," Carter insisted. "It will be money well spent. Unlike the billions of dollars that we ship to foreign countries to pay for foreign oil, these funds will be paid by Americans to Americans."

Congress enacted much of what Jimmy Carter proposed. Coupled with the energy-efficiency standards for cars enacted by an earlier Democratic Congress, and the passage in 1978 of five energy bills directed at spurring energy efficiency and renewable energy, the Energy Security Act of 1980 created a comprehensive and coherent energy policy directed toward eliminating our dependence on imported oil.

Why don't we remember this? In part, because Ronald Reagan entered office only a year after Carter's speech and immediately set about dismantling or dramatically cutting back most of the programs enacted in the 1970s. The energy crisis subsided. A severe worldwide economic downturn in 1981 and 1982 cut the price of crude oil by 75 percent. Depending on imported oil didn't seem so important. The nation dropped back into lethargy.

Fast-forward to 2005. The price of oil again doubles. The Republican-controlled Congress passes an omnibus energy bill. But unlike the energy legislation of the late 1970s, this one does not target imported oil. Indeed, it contains virtually nothing that would reduce our reliance on oil.

Bush tells us to drive less, but unlike Carter, he refuses to demand that our cars become more efficient. Indeed, when California recently enacted legislation requiring new cars to reduce greenhouse gas emissions, the Bush administration joined the car companies in arguing that to achieve greenhouse gas reductions, car companies will have to raise fuel efficiency, and only the federal government has authority over vehicle efficiency. Even when the federal government refuses to do anything, Republicans argue, states cannot step in.

Give me Jimmy Carter in a cardigan sweater any day.

David Morris is vice president of the Institute for Local Self-Reliance, based in Minneapolis and Washington, D.C.

Look at the chart of oil production and you can see exactly what transpired during the Carter to Reagan transition.

See the dip in 1980? That decline into lethargy diverted us from hitting the energy predicament head on. By woolling the pull over our eyes, Reagan inadvertantly delayed the enevitable by a few years, but did absolutely nothing other than to set the stage for the current cronified administration. We have not yet begun to pay the price for this hideous mixture of procrastination and short-term political gratification.

Sunday, October 09, 2005

Shock Model Applied to USA lower-48

The Minnesotans for Sustainability compiled a bunch of interesting oil depletion charts on a single page. I decided to test out the oil shock model on discovery data from the USA lower-48. This contains good historical information of an oil depletion profile past the peak (if you haven't paid attention, our own!).

I used exactly the same base parameters as I used for the fit to the world data, namely each of the fallow, build, maturation phases set to a mean of 8 years, and the average Markov extraction rate set to 0.07 of volume/year (~14.2 year 1/e time). The "unshocked" fit to the data turns out to match the observed production quite nicely.

But the fit can get better. First, ignore the poor fit during the 1930's (depression era). Next, as Laherrere has noted, we can likely account for the perturbations. The first one occurred during the late 1950's:
The initial "voluntary imports quota" of 1957 did not worked and President Eisenhower made them "mandatory" in 1959. The US were disconnecting their domestic oil market from that of the rest of the world, leaving to the large foreign producers the responsibility of managing the market, what they did by creating OPEC the following year, in September 1960.
So that clearly a quota-driven reduction in extraction occurred in the late 1950's, in other words, the first local USA shock. During the 60's, with the quota in place, the oil industry carefully modulated extraction (note that a big dependency on foreign oil did not exist), yet with a peak quickly approaching, extraction rates had to increase to make up for the continuing economic expansion at the time (and to feed the Vietnam War/Great Society guns&butter machine). Once the peak hit, the prorationing reached 100% and the oil industry moved to supplant domestic oil with that from foreign sources.
In March 1971, the balance of power shifted. That month the Texas Railroad Commission set proration at 100 percent for the first time. This meant that Texas producers were no longer limited in the amount of oil that they could produce. More importantly, it meant that the power to control crude oil prices shifted from the United States (Texas, Oklahoma and Louisiana) to OPEC. A little over two years later OPEC would through the unintended consequence of war get a glimpse at the extent of its ability to influence prices.
Actually, 1970 marked another turning point:
The transition. It started in 1969 when the Santa Barbara oil spill triggered some important US environmental laws (Clean Air Act, Clean Water Act). They slowed down the development of domestic energies (mostly coal) at the very time when the US indigenous oil production was going to peak (1970) before decline (see graph 1416). US net imports, which since 1959 were kept at about 20% of US consumption, were relaxed and grew by 25% each annum from 1970 (3.15 Mb/d) to 1973 (6.02 Mb/d), a growth perfectly matched by Saudi net exports. World oil market became tight, as revealed by the successive upwards price revisions in Tehran, Tripoli and Geneva before the October 1973 oil price explosion. The "Club of Rome" was right, oil was unable to fulfil all energy needs, but it was wrong because oil was only scarce in the US 48 lower states but abundant elsewhere.
[...]
Transport demand in the US was hardly affected by the first oil shock because the oil quota put in place by President Eisenhower in 1959 isolated the US oil pricing system from the international oil market However, demand fell strongly at the time of the second oil shock because its timing coincided with the liberalisation of the US oil prices.
I used the following perturbation profile to try to fit to this evolving scenario.

Which gives this shock fit:

What does this prove? I don't have all the answers, but it does show that the oil shock model demonstrates good scaling properties. If we can use the same properties on USA data as I did for the global data, it suggests that the rates have a universal property. It makes a lot of sense, if we consider that a few companies own the state-of-the-art in oil drilling technology and use the same expertise worldwide.

It also gives substantiating evidence for us to once again reconsider the traditional Logistic model to understand oil depletion.


This presentation (PDF), provides some good background on the interaction of the quota system with energy economics. And this one gives some history on the politics behind the Texas oil men and the rise of Halliburton.

Saturday, October 08, 2005

Electrical Shock

I tinkered some more with the schematic circuit analogy trying to generalize it to the oil shock model, and came up with this:

I don't have the shocks in there yet, but I wanted to initially try to demonstrate the effects of stochastic latencies that I first used in a Micro peak oil model, and then extended to an analysis using historical discovery data.

I used a freeware CAD tool / SPICE simulator1 to create the schematic and generate the response curve:

Purple: Discovery forcing function
Cyan:"Fallow phase" response, C1=8.
Red: "Build phase" response, C2=8.
Blue: "Maturation phase" response, C3=8.
Green: Production output, C4=16.

Read the x-axis coodinates as years instead of seconds, and it starts to make sense, i.e. 60s stands for the 1960's. The odd-looking schematic symbol connecting the RC meshes signifies a voltage to current generator which serves to isolate them, and by analogy to a stochastic system, makes them statistically independent. (The staging reminds me of a bit of the Bucket Brigade Devices used in flangers and reverbs. We are in the echo chamber of the original oil strikes.)

And if all this puzzles you, just remember the cry from Soylent Green: "electrons is OIL!!!!"


1Many semiconductor companies give away SPICE simulators in the hopes that engineers will buy their discrete or IC components. Linear Technologies sells one called LTSPICE/SwitcherCADIII which I used. see also www.groups.yahoo.com/ltspice.

Friday, October 07, 2005

Bullies

A congressman from Maryland with much familiarity over oil depletion issues, Wayne Gilchrist (R), cast the deciding House vote to pass the pablum Energy bill. Sounds like he basically got bullied into signing it.

video - [WMV]

Thursday, October 06, 2005

Shock Model with ASPO Discovery Data

Update: This page has had enough references that I should point to an overview.


PeakOil analyst khebab pointed to the ASPO global discovery curve which intrigued me enough to use it as an input forcing function to my oil shock model.

(note that the curve shown above includes a 3-year moving average)

I had to really understand all the latencies involved from the actual point of discovery, i.e. the initial "oil strike", to the point at which each discovery starts producing oil at a mature clip. So based on the elements of the Micro peak oil model, I thought it best to create linear composable latencies that served to shift the point of discoveries in time by the 36 years or so that others empirically observe.
The discovery curve mirrors approximately the production curve with a lag that varies from country to country. The US-48, for example, had a lag of 41 years whilst the UK North Sea production, with its urgency and technological basis had a lag of 25 years. The World's lag is estimated to be 36 years.
The composable stochastic latencies include:
  1. Mean time from discovery to decision to extract -- The "fallow" period
  2. Mean time from decision to extract to completing rig construction -- The "build" period
  3. Mean time from construction complete to maturity of production -- The "maturation" period
If these times remain independent, we can use the convolution technique to generate a mature discovery window. I know that the fallow period can range well over 10 years; for example the industry knew about Alaskan oil well before they made the decision to start extracting. As for the build period, I have a few references that suggest that it takes a minimum of 3 years to construct an oil rig on land and 5 years for an off-shore platform. And the maturity period includes all sorts of extraneous considerations, such as support features (building pipelines, etc) and the possibility of dry wells caused by improper placement. I ended up choosing a Markovian 8-year average latency for each of these phases. This caused the mature discovery curve to match fairly well to the triangular discovery curve that I used in the past for the oil shock model (of course this curve does not show the sharp peaks of the triangular curve).

Finally, I added the previously described extraction phase to the model. The extraction rate basically relates the mean time to deplete a reservoir to 1/e of its original value (or to 36.8% of its initial volume). As suggested before, I use as an implicit assumption that any rate of extraction or flow is proportional to the amount available and nothing more; past and future history do not apply.

And as the final necessary ingredient to match the spiky/notchy behavior of global production, I add the oil shocks which tend to suppress the production during critical geo-political periods. The following fit to the BP data assumes the initial ASPO data as the forcing function, the 3 mean latencies occurring before mature production, an initial extraction rate, and the 3 shocked (or perturbed) extraction rates to match the dips. As the final frill, I then added a reverse shock starting after 2001, on which Bubba previously posted some suspicions :
"The orange squares are the BP cumulative data, right? What is causing the upturn in the orange square trend around 2004?"


Because of my use of external data for discoveries, which actually constitute someone else's estimates and therefore may turn out low, take the curve at face value. I don't know the history behind the ASPO numbers, but just as a cautionary note, I can summarize with this statement : "gulp".

SOURCE CODE


Prints to standard out "Year", "ModelResults", "BPData"

with Text_IO;
with Ada.Numerics.Elementary_Functions;

procedure ASPO is
type Flt is array (Natural range <>) of Float;

-- Safe array retrieval function
function Get (Arr : Flt; I : Integer) return Float is
begin
if I in Arr'Range then
return Arr (I);
else
return 0.0;
end if;
end Get;

-- Discretized convolution function
function Convolve (A, B : in Flt) return Flt is
Total : constant Natural := A'Length + B'Length;
C : Flt (0 .. Total);
V : Float;
begin
for J in 0 .. Total loop
V := 0.0;
for I in 0 .. J loop
V := V + Get (A, I) * Get (B, J - I);
end loop;
C (J) := V;
end loop;
return C;
end Convolve;

-- Discretized exponential function
function Exponential (L : Natural; Alpha : Float) return Flt is
use Ada.Numerics.Elementary_Functions;
R : Flt (0 .. L - 1);
begin
for I in 0 .. L - 1 loop
R (I) := Alpha * Exp (-Alpha * Float (I));
end loop;
return R;
end Exponential;

-- Data transcribed from ASPO discovery curve
-- http://wolf.readinglitho.co.uk/mainpages/discoveries.html
Strikes : constant Flt := -- GBBls/year starting year 1932
( 9.0, 4.0, 4.5, 3.0, 5.0, 5.5, 42.0, 42.5, --1930's
52.0, 18.0, 16.0, 5.0, 3.0, 7.4, 7.6, 7.0, 49.0, 53.0, --1940's
54.0, 19.5, 16.0, 26.0, 20.0, 28.0, 24.0, 35.0, 40.0, 40.5, --1950's
42.0, 44.0, 50.0, 41.0, 50.0, 48.5, 47.5, 32.0, 30.5, 30.4, --1960's
29.5, 40.5, 37.0, 38.5, 24.0, 26.5, 31.0, 37.0, 38.0, 36.0, --1970's
26.0, 24.0, 20.0, 20.0, 22.0, 21.0, 20.5, 18.0, 16.2, 17.5, --1980's
16.5, 20.0, 17.0, 16.0, 9.0, 8.5, 9.0, 9.0, 9.5, 14.0, --1990's
18.0, 17.5, 13.0, 9.0, 9.0); --2004

Avg_Fallow : constant Flt := Exponential (200, 0.125); -- 8 years
Avg_Build : constant Flt := Exponential (200, 0.125);
Avg_Mature : constant Flt := Exponential (200, 0.125);
Discovery : constant Flt := Convolve (Strikes,
Convolve (Avg_Fallow,
Convolve (Avg_Build,
Avg_Mature)));
-- Safe function for reading forcing function
function Discovery_Window (Year : Float; Start : Float) return Float is
Y : constant Float := Year - Start;
begin
if Y < 0.0 then
return 0.0;
end if;
return Discovery (Integer (Y));
end Discovery_Window;

-- British Petroleum data
BP_data : array (1965 .. 2500) of Integer := -- in million Bls/day
(1965 => 31803,
1966 => 34568,
1967 => 37118,
1968 => 40436,
1969 => 43633,
1970 => 48061,
1971 => 50844,
1972 => 53666,
1973 => 58463,
1974 => 58617,
1975 => 55824,
1976 => 60412,
1977 => 62713,
1978 => 63331,
1979 => 66049,
1980 => 62946,
1981 => 59533,
1982 => 57296,
1983 => 56598,
1984 => 57683,
1985 => 57468,
1986 => 60461,
1987 => 60785,
1988 => 63160,
1989 => 64051,
1990 => 65470,
1991 => 65288,
1992 => 65788,
1993 => 66046,
1994 => 67116,
1995 => 68103,
1996 => 69895,
1997 => 72158,
1998 => 73586,
1999 => 72333,
2000 => 74950,
2001 => 74828,
2002 => 74443,
2003 => 77054,
2004 => 80260,
others => 0);

type Shock is record
Year : Float; -- Year of shock
Rate : Float; -- Rate of extraction
end record;
type Shocks is array (Natural range <>) of Shock;

S : constant Shocks :=
((1932.0, 0.070), -- Start of data
(1974.0, 0.070), -- Start of oil embargo
(1974.5, 0.065), -- End of oil embargo
(1980.0, 0.065), -- Start of Iran hostage crisis
(1983.5, 0.044), -- End of recession
(1990.0, 0.044), -- Start of Gulf War
(1992.0, 0.042), -- End of recesssion
(2001.0, 0.042), -- Last good year!
(2003.0, 0.046), -- Running Out??? Why is extraction going up?
(2100.0, 0.046));

-- Make the shock a continuous function
-- by interpolating between points in the list
function Interpolate_Shocks (Year : Float) return Float is
K : Integer := S'Last - 1;
begin
for J in S'First + 1 .. S'Last loop
if S (J).Year > Year then
K := J - 1;
exit;
end if;
end loop;
return S (K).Rate +
(S (K + 1).Rate - S (K).Rate) * (Year - S (K).Year) /
(S (K + 1).Year - S (K).Year);
end Interpolate_Shocks;

C : Float := 0.0; -- Reserve
Rate : Float; -- Extraction Rate
P : Float; -- Production Rate
DT : constant Float := 0.01; -- 1/100th of year
Start : constant Float := S (S'First).Year;
Finish : constant Float := S (S'Last).Year;
Time : Float := Start;
V : Float := 0.0; -- Volume of oil extracted
Data : Float := 0.0;
begin
loop
-- Integration of discovery window against extraction rate
Rate := Interpolate_Shocks (Time);
C := C + Discovery_Window (Time, Start) * DT - C * Rate * DT;
P := Rate * C;
V := V + Rate * C * DT;
if Time > Float (Integer (Time)) - DT / 2.0 and
Time < Float (Integer (Time)) + DT / 2.0
then -- Print output only once per year
if Time >= Float (BP_data'First) then
-- BP data only available beyond a certain date
Data := Float (BP_data (Integer (Time))) * 365.0 / 1.0e6;
end if;
Text_IO.Put_Line
(Integer'Image (Integer (Time)) & "," &
P'Img & "," &
Data'Img & "," &
Float'Image (V));
end if;
Time := Time + DT;
exit when Time > Finish;
end loop;
end ASPO;

Wednesday, October 05, 2005

OFF

Finally, someone noticed the lack of balance in the so-called Iraq Oil-For-Food (OFF) scandal stories over the past few years:
The most prolific OFF scandal pimp has been Niles Lathem writing in Rupert Murdoch's New York Post. Over the past 18 months, Lathem has written 141 items in The Post -- about 8 per month.
The author of the piece, Joshua Holland, rips a collective hole in a cadre of Scandal Pimps including the fawning flatulator, Hugh Hewitt, who "argued in the Weekly Standard that Claudia Rosett deserved six Pulitzers" for her work in the story.

So, in retrospect, the "scandal" did not amount to that big a deal after all. But, as of June of this year, the geniuses at Powerline blog had contributed a total of 26 stories on oil-for-food but none on peak oil/oil depletion.

One of these days they will collectively wake up from their slumber, trade their SUV's in, and thereafter act like nothing ever happened. AKA CYA.

Senator practices the art of flaming

This quote by Hillary Clinton if packaged in an email and sent to an engineer or scientist would classify as a traditional "flame":
Not all senators were uniformly impressed. Hillary Clinton was the first to try to cut him down to size. "His views on climate change are at odds with the vast majority of climate scientists; it also appears in a work of fiction," the senator for New York said dismissively. "I think that the topic of this hearing is very important but organised in a way to muddy sound science rather than clarify it," she added, before thanking the other four witnesses who attended, but not Crichton.
How un-senatorial!

Monday, October 03, 2005

Logistically Impossible

I really don't believe that the Logistic curve applies very well to the problem of estimating oil depletion rates. No matter what you hear and read, the formulation of the Logistic curve just doesn't have the correct physical basis to stand on its own feet. To many, this may sound like heresy, as oil analysts since Hubbert have used the differential equations (in particular, the Verhulst equation) describing the Logistics curve to estimate when peak oil would hit. More than anything, I think its utility came about more through coincidental properties that just happened to match those that should come about through a more mathematically rigorous and sound physical basis. In general, I think we violate Occam's razor by attributing something complicated and not physically possible in the oil depletion context (i.e. the Logistic curve) to something that we can explain away much more simply and with a better fit.

Of course, several issues crop up to make it difficult to stem the tide of use for the Logistics curve (note: the derivative of the Logistics curve gives the familiar "Bell-shaped" Hubbert curve familiar to most people). These include:
  1. Poor or closely-held data
  2. Data transformations that obscure content
  3. Inertia
  4. Convenience

I don't think we can do anything about the first issue. I try to use historical data wherever possible, preferring to understand where we came from rather than try to predict the future. By and large, we can only predict the peak when we hit it. But the data remains so limited that any "good" fits to the Logistic curve gain extra weight.

As for the second issue, I consistently see strange data transformations applied to the data. This includes the common integral formulation, typically used to show cumulative productions as a function of time (or some other variable). Everyone has got to realize that integration acts like a great filter, which many times serves only to obscure the original data. What a waste! And when the other variable does not show independence, we compound the problem. For example, the more I look at it, the more I dislike plotting Production/CumulativeProduction against CumulativeProduction. My father once told me a story long ago about going to a talk by another engineer who got very excited about this great correlation he found in his data set. His data points aligned very well, all falling along a straight line. Well, as it turned out, the engineer had plotted X against X! This sad tale demonstrates what happens when you start mixing dependent variables together; you can too easily get biased correlations.

Inertia in use of the Logistic curve frustrates me to no end. The aforementioned data transformations seem to spontaneously appear whenever someone wants to "fit" to the Logistics curve. This tends to reinforce the application of the Logistic curve. I think we ought to stem the tide in knee-jerk use rather quickly. Far too many analysts have seen the straight lines in their data, and immediately adopt the Logistic curve to do multi-parametric estimations and other fits to discern trends. Pssst, obeying the herd mentality often only gets you to the wrong result faster.

The convenience of the Logistics model sums up the current state-of-the-art with respect to its use. Consider again how many analysts plot dQ/dt / Q against Q to try to see the famous "linear" behavior predicted by the Logistic curve. Pretty nifty, huh? And that remains the crux of the problem. We should not contaminate one already dependent variable onto the axis of the other variable -- unless you know for sure that this fits some realistic behavior, it really biases the outcome. For example, to someone familiar with the easy-way-out of mathematical modeling it looks like the "drunk looking for his keys under the streetlight" scenario. Why does he look there? That's where the light is! So, we all use this formulation because of its convenience, not realizing that it could lead us down the wrong path.


So how did the adoption of the Logistic curve come about? I don't know all the historical roots, but Stuart Staniford posted again recently on Hubbert linearization over at TOD. He gives a reference to work he has done on modeling what I call "Predator-Prey" relationships, which invariably leads to the equation leading to the Logistics curve:
da/dt = k*a*(1-a)
In the logistic equation, you use the term "a" and "1-a" to refer to a quantity and its complement. Now I understand that Staniford wants to use "a" to refer to some some economic scalar that grows exponentially, while "1-a" to refer to the oil reservoir itself. That makes absolutely no sense from a mathematical point of view, as in the familiar case of mixing apples with oranges. Unless someone establishes a physical relationship between "a" and "1-a", I wouldn't go near solving this equation. And if a relationship did exist, it might not prove linear. In that case, the tidyness of the solution evaporates.

In the normal predator-prey relationships, you can get away with this stuff because you deal with discrete entities that have at least an empirical relationship. For example, it takes N rabbits to sustain a single fox. Or one virus to infect one unprotected computer. Or an anion and a cation to generate a molecule. So, understanding how analysts have used the logistic model in the past --as a variant of the "pedator-prey" class of processes-- I believe the modeling premise will have greater viability when applied to another pressing issue of today, that of the potential spread of avian flu.1 Important, yes indeed, but please keep it away from the study of peak oil.

QUESTION: So I ask myself, how can this a*(1-a) relationship come up in the context of oil depletion?

From the application of the oil shock model, the terms come about from the driving function to this differential equation:
dR/dt = U(t) - E(t) * R(t)
Which reads: The rate of production equals the discovery rate minus the extraction rate applied to the current reserves. Besides an RC circuit, the expression also reminds me of an economics "Supply - Demand" formulation. The tricky term remains U(t) which acts like a forcing function. In the past, I have used a triangular discovery function as a first cut. But in reality, discovery also acts as a self-limiting function, and I do not necessarily have to artificially constrain it with a triangular discovery window. The acceleration of discoveries over time naturally decreases. It essentially does something like this:
a(t) = k * (1 - t/T)
This basically means that the acceleration in the number of discoveries decreases over time, much like the number of strikes during the Gold Rush days showed a maximum acceleration at first, but then declined over time until all discoveries stopped in practical terms.

But we do not actually see the acceleration in the real world; we instead see the velocity, or the number of discoveries made per unit time. And you get velocity by integrating acceleration over time:
v(t) = k * t * (1 - t/2T)

And this just happens to look like the curious a*(1-a) Logistic term; an upside down parabolic function (Update 10/4/05: aka the Welch window, see figure at right) that provides the driving function to solve the oil shock model. Just a bit of pure calculus straight from Newton. (Furthermore, it doesn't give that much of a different solution to the Oil Shock Model than the triangular forcing function does)

ANSWER: So yes, you can get the a*(1-a) relationship in the context of oil depletion, with a real physical basis. Unfortunately, the a term turns into a time, t. I have no idea where and how this whole formulation got all bent out of shape.

Contrary to what many analysts believe, nothing exponentially grows. We just have a cumulatively growing set of tapped reserves, which takes work and time to find. This gets offset by a depletion activity which stays proportional to the amount of oil in each new reserve tapped. Unfortunately this does not describe the Logistic model, which I find more suited to the epidemiological and ecological sciences, and also to some fairly arcane chemical growth models that I did my thesis work on in the 80's. Trust me, no way does this model work for oil depletion. It just happens to give an empirical fit. And people have started building heuristics around this model. Bad idea.

This leads me into explaining the reasons for the good historical empirical match. The basic idea, first promulgated by Hubbert in the late 1950's (and then Deffeyes) states that the solution to the logistic equation leads to an empirical fit to real world data when plotted this way:
dQ/dt / Q = K*(1-Q)

I think it fairly straightforward to understand the asymptotic behavior without resorting to the logistic equation. Mathematically, consider that the differential equation governing extraction assumes a forcing function (i.e. discoveries) that have largely occurred sometime in the past when you enter the tail regime. To a good approximation, extraction stays proportional, first order, to how much is left (see stripper wells for the realization of this). So taken far enough to the future, the forcing function looks like a delta function, and the solution set matches the exponential function. Then when you plot Y=dQ/dt/Q vs X=Q you get exp(-kt)/(1-exp(-kt)) plotted vs (1-exp(-kt)). In the regime where the Hubbert linearization graph appears linear and it gets close to 90%, so does the exponential. And the match gets better if you put a bit of a spread in the delta function. Therefore you cannot tell the difference and the exponential model wins out because it matches a real physical process.


In other words, this has the asymptotic property of the extraction rate "appearing" to intercept the x-axis at the ultimately recoverable resources (URR) when y eventually reaches zero. However, it never gets there. It behaves correctly, but it has nothing to do with the Logistic curve. It acts more like a very thin man walking toward a wall, every second going halfway there, and then realizing mathematically that he will never hit the wall.

And then notice how the curves match best when we are deep into depletion (i.e. Texas). At that point, we do not need to figure out the URR; to use an electronics analogy, the process just discharges the capacitor in an RC circuit. The Logistic formulation just happens to work when you start fitting past peak because of the strong decline component. No one can prove that it works early on because of a weak premise and the fact that for some reason the plots get filled with "noisy" data in that regime. I believe it looks way more hyperbolic than the data that Laherrere and company suggests.


I have a post up describing the quasi-hyperbolic behavior that likely fits betterhere and a more recent post showing how the math also describes the behavior of a simple electrical RC circuit here.


Why do I make a big point of this model? Partly to counteract the impacts of peak oil critics like Michael Lynch. Lynch and company have a field day in dissembling Logistic-based models. The common practice in those circles leads to simply trashing another's model; Lynch then doesn't even have to come up with his own. Look at how well this strategy works in today's political circles. If you don't have a good model for what their agenda pushes, it doesn't matter that they don't have one either -- it suffices to make you look bad. Michael Lynch also objectively scoffs when he looks at the traditional Hubbert models. He doesn't say it in exactly this way, but assuming gaussians in particular breaks causality. He extends this to the Logistic curve sigmoids when he sees the long negative tail. While I don't agree with this completely, as you typically start the sigmoid at some finite value, no one has ever articulated where it should start. But then again, we just proved the Logistic curve as bogus. Lynch doesn't have that red herring to beat up on again.


1 In nature, when you use the logistic model, it starts with a small population of discrete entities, and you let it proceed to (consume/infect/kill/bond) one entity. Then you can sit back and watch as the reaction propagates. The predator prey relationships work best on homogeneous populations. Another, but not the most important, reason to stay away from it. If you really want to see what kind of trouble you can get into using the Logistic curve sigmoid, go to this Java applet. Scroll down to small values of P and R and you can see how touchy the whole thing is. Touchy too on initial conditions, which always gets conveniently swept under the rug in modeling discussions.