[[ Check out my Wordpress blog Context/Earth for environmental and energy topics tied together in a semantic web framework ]]

Thursday, December 28, 2006

Chunk of change

Snooping around after hearing from Malloy about the Ellesmere Island ice shelf breakup in northern-most Canada, I found this tell-tale crack via Google Earth:

The approximate size matches that reported of 66 square kilometers. Some concerned soul got there a little bit early and left a community note.

Update: That location appears wrong. Elsewhere I found the Ayles Ice Shelf as positioned at the northernmost part of the island, Latitude: 82.83333, Longitude: -80.56667. Google Earth has very low resolution here, and whatever broke off would look like a sliver.


The melting of the icebergs that this chunk created will further displace sea-levels elsewhere. Consider the island of Lohachara where the Ganges river empties into the Bay of Bengal. With little fanfare it recently sunk below the water-line.

The uppermost arrow points to the island where apparently 10,000 residents once lived (10,000 people per km2?). The lower arrow I believe points to the uninhabited island of Suparibhanga (or Bedford?), which now looks like a submerged sandbar from the satellite photos.

Tuesday, December 26, 2006

Monbiot

I finished George Monbiot's latest "Heat" and so will offer up a classic quote. This vaguely biblical one-liner references the amazing amount of energy waste that goes into keeping grocery stores operating:
But though you walk through valleys of ice, you remain warm.
And one for the bonus round:
Buying and selling carbon offsets is like pushing the food around on your plate to create the impression that you have eaten it.
I consider it a fairly upbeat read, and with the U.N. downward revising global warming impact by 25%, Monbiot's recommendations might hit their targets with a hip, thanks to some creative bookkeeping by the blue helmeted ones.

Update: Big Gav has commentary on a recent Monbiot article here, which I must admit provoked me to finish the book.

Wednesday, December 20, 2006

Glass

The lack of snow and mild winter in The North Country has caused the lakes to freeze up in sheets of perfect glass. I put on new bindings on my clap skates and have had several good outings. Mother nature's layout artist doesn't permit me to get from point A to point B by skates alone, but one can always dream.

Imagine this scene without the rescue workers. Watch out for those creek inlets!

Monday, December 18, 2006

The Conun Drum

From a post on The Oil Drum, Rapier pondered the mysteries of reserve growth.

I've hinted at this before, but I wanted to nail a simple idea centered around reserve growth. As a premise, let me create a hypothetical situation. Say starting from right now, i.e. Time=0, we find a growth in reserves that goes like 1/(Time+k), where "k" is some small number to keep the starting number finite. Let's say that this reserve growth falls in the provable category to indicate that we can extract it.

Three interesting results spring from this premise.
1. The amount of reserve left from now until eternity sums to an infinite number. This derives from a property of integrating a hyperbola (1/Time) over all of time. In other words, we get a URR of infinity.
2. If production follows a rate proportional to the current reserves (the classic "greed is good" assumption which explains man's and the free market's capitalistic instincts), the position of peak won't change too much. This has everything to do with rate considerations; the rate of reserve growth cannot match consumption rates, and new discoveries clearly continue to dwindle.
And most importantly, the one thing that explains Rapier's puzzlement.
3. The draw-down from reserves can become vanishingly small in this scenario. Taking finite production from an infinite pool leads to the conundrum that we will continue to extract an infinitesimal fraction of that eventually available.
I consider the argument quite subtle, so that if interpreted incorrectly, it gives ammunition to the cornucopians, who can assert that huge reserves lay in wait. However, in reality, since oil depletion occurs proportionally to current reserves, we end up seeing the classic effect of "diminishing returns". Of course this has real ramifications for a continuously growing energy-based global GDP economy, but the cornucupians will not spin it that way. They instead point to a continuously finite reserve that doesn't get drawn down by as much as one's expectations can intuit.

The above figure shows an extraction term corresponding to an exponential and a reserve growth indicated by a 1/(T+k) function. The convolution of the two -- shown below1 -- roughly gives an idea of the overall extraction. (A variation of this forms the basis of the oil shock model)

Having to face and account for this argument, a cornucopian would have to propose a reserve growth rate that will keep pushing the peak into the future. Unfortunately, this would result in a growth even more aggressive that the 1/Time variant, which already has an infinite URR ! Fortunately, anyone actually proposing such a growth rate puts themselves in a situation of endless mockability.

We have to continue to question the numbers because otherwise we fall into the logical conundrum B.S. traps that politicians and corporations and scam artists have historically used to try to separate us from our money. Simple thought experiments like I have shown here remain one of the few options that we have to eliminate the rhetorical arguments from the public discourse.

As a recent and complementary example of where people have gotten hoodwinked in this fashion, google the "infinite horizon" argument to escalating Social Security costs. Bush's people have actually suggested huge future costs of S.S. based solely on a hidden assumption of an "infinite horizon". It takes time for the economists to dig this stuff out of the rhetorical arguments, but by that time the spinners have inflicted the damage and people get a completely misleading impression of the issue. I remember hearing Al Franken debunk this argument quite effectively by saying that, "yes we may have a huge SS deficit, but will have infinite time to pay it off, so it looks like our current funding is no problem". Touche.


1 Spreadsheets don't have a convolution function as far as I have found, but as a trick that Khebab would appreciate, use the Fourier transform on each function, do a complex multiplication, and then do an inverse transform on the result. This does the convolution effectively, albeit in a round-about way.

Sunday, December 17, 2006

Alaska Peak

The following data from Laherrere brings up some interesting issues to contemplate with regards to depletion modeling.

Oil companies discovered oil in Cook Inlet (Swanson River) in 1957 and on the North Slope (Prudhoe Bay) in 1968. I found a forecast for North Slope of 22.3 billion barrels and a total extraction of 1.06 billion for Cook Inlet.

For North Slope I used the discovery date and the forecast as a stimulus to the oil shock model, and added the Cook Inlet model separately. For North Slope, I used values for fallow, construction, maturity, and extraction of 0.15 and for Cook Inlet, I used values of 0.2. The shock model production curve looked like:

I found it interesting that a strong discovery stimulus with typical rates adequately describes the curve:

In spite of the conflict between the stochastic premise of the model and the determinism implicit in a single field, the shape largely matches -- except for one significant area. Production only commenced on Prudhoe in 1977, as soon as workers completed the Alaska Pipeline. So we see a sudden surge in production in the actual curve around 1977 which does not show up in the shock model. Since companies worked on construction of the rigs and pipeline in parallel, something has to give. I suppose that extracted oil prior to the completion of the pipeline might have got wasted or stored in reservoirs. Naturally this does not show up in production numbers but it has to pop out somewhere. Otherwise, one must suppress extraction until the pipeline opened up, which would have produced a large shock right around 1977 -- something entirely doable within the context of the oil shock model.

So if I leave the extraction rate at some small number like 0.01 until 1976 and then jump up to 0.15 in 1977, the model looks like this:

In general, a lot of this detail gets washed out as we take larger sets of reservoirs with varying discovery dates, yet the single set provides us with mucho insight -- without invalidating the fundamental premise of the shock model.

Saturday, December 16, 2006

Produce

From a batch of purple Peruvian potatoes we got from the farmer's market came this odd trio:

In the bunch we found two stones the same size and look as a potato, and a real potato that looked like a cross between Mickey Mouse and Piglet.

Tuesday, December 12, 2006

Sleeping Gas

Barry McCaffrey looks displeased. An equally perturbed Edvard Munch screams from Google that CERA has paid money for the top spot on the query "Peak" "Oil". This ends up alerting everyone within earshot that "Peak Oil Theory Flawed".

A couple of Google pages in under Peak Oil, I noticed that Julian Cope's Head Heritage web site featured a peak oil article from last year. Cope, who started out as a Liverpudlian neo-punk, took leave of his senses for a while (check out the schizoid dual memoirs "Head-On/Repossesed"), and later became a music archivist and amateur druid archaeologist. I picked up his huge picture book "The Modern Antiquarian" several years ago and recommend it to anyone that enjoys visiting ancient UK sites. Drugs could have gotten Cope committed; fortunately he recovered and instead committed himself to undertaking some pretty interesting and intense pop-research. It looks like Cope has produced another massive picture-book, available soon called "The Megalithic European: The 21st Century Traveller in Prehistoric Europe".

I find this stuff more interesting than speculating what will happen in a post-peak economy. Just remember that what goes around comes around. And witness the fact that people have started habitating in well-preserved Star Wars movie sets. Non-fiction remains stranger than fiction.

Monday, December 11, 2006

Scratch Head Time

If you want to waste lots of time, fly around Google Earth and try to figure out weird geometries in isolated regions.

Sunday, December 10, 2006

Anger is an Energy

As I engage in a decent workout run, I have no trouble listening to some idiotic, content-free spew such as Matt Drudge produces. Everyone knows that the old "hate-buzz" kicks in the adrenaline and provides a virtual sparring partner for one to triumph over. Drudge proved no-match tonight as he brought in the scientifically illiterate Oklahoma Senator James (Republican) Inhofe to discuss global warming topics. So I had two sparring partners, an idiot and an illiterate. At the end, Drudge dropped this bit of pseudo-Haiku, suggesting for us to "Look at Tahoe,"
Wasn't Tahoe an iceberg
that melted, or something,
I don't know.
-- Matt Drudge
We really should not listen to these people. Earlier, Inhofe credited Drudge as the lone voice in the media promoting the anti-global warming message. Go ahead Senator, hitch your wagon to another scientifically illiterate idiot. Wheee.
I could be wrong
I could be right
...
Anger is an energy - PiL
Must think good thoughts. So I switched to the Trouble MP3 and listened to the latest by Royce.
MVRemix: What is it about girls on bikes?

Justus Roe: I don't know. You know what it is? It was me and Mestizo and Jaime from Royce walking around in Zurich. We were in the Red Light District. We were flabbergasted about the amount of beautiful girls riding their bikes around the city. We concluded that the bikes and a steady diet of yogurt made those girls so extra fresh. Every time a girl rides past me on a bike, I can't do anything but watch that sh*t. If I didn't, humans wouldn't be on earth. It's evolution.
More like it. Evolution always triumphs.

Wednesday, December 06, 2006

USA N.G. (Not Good)

I recently posted a model of USA natural gas production based on discovery data of Laherrere. This model assumed a constant depletion rate over time and fit the real production curve in scale only. I prefaced use of the model with the caveat that natural gas reservoirs may not necessarily deplete at a rate proportional to the amount left, which forms the underpinnings of the oil shock model. I imagine that a natural gas reservoir might deplete closer to an analogous water cooler, maintaining a steady flow until empty -- which conversely also means that one can throttle the rate presumably just as easily.

As the shock model does allow a variation of extraction rate over time, I decided to fit the production curve again, but this time letting the extraction rate vary all over the place.

As a first step I adjusted the (fallow,construction,maturation) rates down to 0.1 (10 year 1/e time) from the previous 0.133 to match the early evolution of the curve. Combining the static rates with the variable extraction rates I generated the following fit and error curve.


Remember that this pertains to conventional sources of natural gas; de Sousa covers the distinction between conventional and unconventional in a TOD post, but this goes in more detail. Other than that, it looks like we have started to squeeze the blood out of the proverbial turnip. I really think the increase in extraction rate comes from improvements in technology allowing us to more than maintain the flow in the face of increases in demand. Sucking out 10% per year of the volume worked fine for us for the better part of last century, but as we hit the 80% (!) level, hard constraints have to follow. And that means we will soon see the steep cliff typical of natural gas depletion. Why don't any of the news organizations talk about this? Do the energy companies figure that we will go quietly, whistling past the graveyard as these conventional sources of NG disappear? (pause for rhetorical interlude)

And remember the helium shortage during the recent Thanksgiving holiday? Guess where helium comes from? Certainly not unconventional sources of natural gas. Oh yeah .. reservoirs containing conventional natural gas. Double gulp. Not good.

Bye-bye toy balloons, hello bulbous LNG tankers.

Update: On reviewing my only other natural gas model, New Zealand NG shows the same characteristic upswing in extraction rate on nearing a cliff. Note that USA extraction rate more than doubles in a similar time frame.

Tuesday, December 05, 2006

USA N.G.

TOD:Europe has pulled together data from a recent Laherrere presentation here. TOD's Luis de Sousa concentrated on Laherrere's USA natural gas analysis and in particular the following chart.

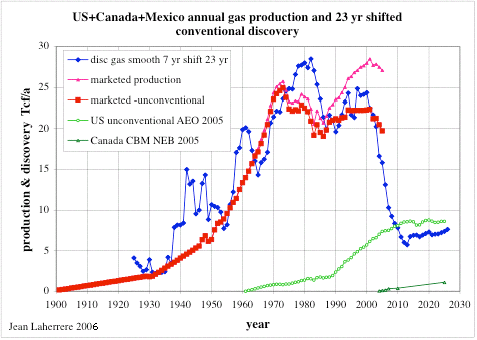
Notice the obvious time-phased shadowing of the discovery curve by the production curve, and the implied reserve depletion that this portends. Albeit, some of the gloom gets abetted by the rise in unconventional NG deposits.

I haven't used the Oil Shock Model that much to predict natural gas production, partly because of the lack of discovery data and partly because of the supposed abrupt dynamics of natural gas reservoirs (e.g. do they really shut down that quickly at the end of their lifetime?). The latter issue might imply that we can't quite as confidently assume a depletion rate proportional to the volume as a first-order estimate. On the other hand, big reservoirs, like big aquifers, do produce quantitatively more than small ones, so this approximation holds some merit.

It mildly sucks that Laherrere likes to put a filter on his discovery profiles (see above figure, in this case, a 7-year average). The shock model would rather gobble up the raw data and generate a meaningful production profile. Indeed, I have tried it on New Zealand NG and see no reason that it wouldn't work on USA NG as well, caveats or not.

In any case, given the fact that Laherrere provided some kind of discovery data, I decided to give the USA conventional NG data a shot with the model. I chose fallow, construction, maturation, and depletion rates of 0.133/year (which is a fairly standard 7.5 year mean, in terms of oil depletion models) and I got the following dark line fit:


What do the 0.133 numbers physically mean? In a stochastic world, all it means that it takes, on the average, about 7.5 years to start work on a discovered field, 7.5 years to get construction finished, 7.5 years for it to reach maturation, and simultaneously factor in a depletion rate of 0.133 volume per year. The aggregation of these terms causes the discovery profile to shift approximately 23 years (according to Laherrere's opinion) to match the production profile. Understand that this analysis does not necessarily work on individual fields, but to first order (a Markovian process) it does explain everything you need to know on an aggregated set of fields, any one of which can vary according to its own specific parameters (i.e. how long it sat fallow, how long construction took, etc).

The deterministic, or shock, aspects to the model come about when political or economic effects are taken into account. Even though I did not add it to this particular model, rapid changes, due to collusion or world events or technology, can cause the extraction rate to adjust at certain points in the curve. This allows one to get insight into deviations from the general trend.

From the residual errors, you can see max deviations around depression/WWII, 1971, 1984, and 2000 (the stuff before 1920 looks made up as the line looks way too straight). I would consider these candidate time points for introducing changes in the extraction rate. Before doing that, though, I would love to remove that darn 7-year moving average -- like the people imprisoned by the Patriot Act, data needs freedom from shackles!

Friday, December 01, 2006

Out of the firewall, into the fireplace

The firewalled NYT article The End of Ingenuity at Thomas Homer-Dixon's web site.

Air America's Ecotalk had several interesting interviews today:I've heard rumors of major blood-letting and the cutting of several programs at AAR, shame if they get rid of this one.

Maron and Earl subbed for Sam Seder this morning, a great energy rant to start off the show and a few great bits, podcasts here.
Marc Maron: "Nothing can be done but to shift the entire energy paradigm"
And the Cardinal's Rapture Watch monitoring the end-times.
Jim Earl: "I told you how a burning squirrel suddenly appeared in the fireplace of a terrified family. The weeketh after that I told you how a naked man was pulled from the jaws of an alligator. And the weaketh after that I told you if you were going to throw a squirrel down your neighbor's fireplace, don't be surprised when they throw your drunken naked ass into the local alligator pond."

UK Models

Mearns at TOD penned an extensive review of the UK North Sea oil production decline along with some of his own models.

I placed the oil shock model from August 2005 on top of his TOD chart below:

The future bumps in some of Mearns model predictions come from new fields coming on line such as the Buzzard field discovered in 2001. This one barely got included in the discovery input for the oil shock model, but more recent discoveries such as Rosewood/Lochnagar in 2004 have not. The North Sea oil region more than anywhere else demonstrates how new discoveries remain the only way to halt the inexorable decline.