USA N.G.
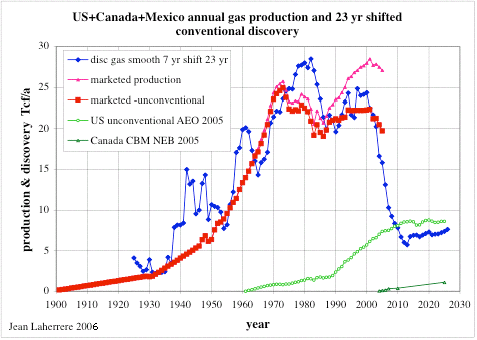
TOD:Europe has pulled together data from a recent Laherrere presentation here. TOD's Luis de Sousa concentrated on Laherrere's USA natural gas analysis and in particular the following chart.

Notice the obvious time-phased shadowing of the discovery curve by the production curve, and the implied reserve depletion that this portends. Albeit, some of the gloom gets abetted by the rise in unconventional NG deposits.
I haven't used the Oil Shock Model that much to predict natural gas production, partly because of the lack of discovery data and partly because of the supposed abrupt dynamics of natural gas reservoirs (e.g. do they really shut down that quickly at the end of their lifetime?). The latter issue might imply that we can't quite as confidently assume a depletion rate proportional to the volume as a first-order estimate. On the other hand, big reservoirs, like big aquifers, do produce quantitatively more than small ones, so this approximation holds some merit.
It mildly sucks that Laherrere likes to put a filter on his discovery profiles (see above figure, in this case, a 7-year average). The shock model would rather gobble up the raw data and generate a meaningful production profile. Indeed, I have tried it on New Zealand NG and see no reason that it wouldn't work on USA NG as well, caveats or not.
In any case, given the fact that Laherrere provided some kind of discovery data, I decided to give the USA conventional NG data a shot with the model. I chose fallow, construction, maturation, and depletion rates of 0.133/year (which is a fairly standard 7.5 year mean, in terms of oil depletion models) and I got the following dark line fit:

What do the 0.133 numbers physically mean? In a stochastic world, all it means that it takes, on the average, about 7.5 years to start work on a discovered field, 7.5 years to get construction finished, 7.5 years for it to reach maturation, and simultaneously factor in a depletion rate of 0.133 volume per year. The aggregation of these terms causes the discovery profile to shift approximately 23 years (according to Laherrere's opinion) to match the production profile. Understand that this analysis does not necessarily work on individual fields, but to first order (a Markovian process) it does explain everything you need to know on an aggregated set of fields, any one of which can vary according to its own specific parameters (i.e. how long it sat fallow, how long construction took, etc).
The deterministic, or shock, aspects to the model come about when political or economic effects are taken into account. Even though I did not add it to this particular model, rapid changes, due to collusion or world events or technology, can cause the extraction rate to adjust at certain points in the curve. This allows one to get insight into deviations from the general trend.
From the residual errors, you can see max deviations around depression/WWII, 1971, 1984, and 2000 (the stuff before 1920 looks made up as the line looks way too straight). I would consider these candidate time points for introducing changes in the extraction rate. Before doing that, though, I would love to remove that darn 7-year moving average -- like the people imprisoned by the Patriot Act, data needs freedom from shackles!


0 Comments:
Post a Comment
<< Home