
Prankster's Gallery
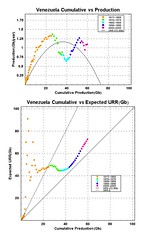
Not since Ken Kesey's day has a group of like-minded individuals deserved the moniker of prankster as the cabal of oil depletion analysts (not). Just look at this gallery of production curves, stunningly and meticulously put together at GraphOilogy.
Graphoilogist Khebab posted a couple of interesting and potentially relevant volatility charts to TOD a few days ago. In light of the spectactularly huge speculative losses in natural gas hedge funds and ongoing fluctuations in the price of gasoline, this must have a lot of people thinking -- do resource constraints wreak such havoc on the supply/demand curves that all bets go out the window on expecting any kind of stability?
posted by @whut at September 19, 2006
![]()
![]()


0 Comments:
Post a Comment
<< Home