
Entroplet / Species Area Relationships
Ecologists use a concept called Species Area Relationships (SAR) to figure out diversity and richness in a plot of land. The field ecologist parcels up a few hectares of land into plots and start cumulatively counting the number of unique species that appear on each subarea of land.
Lots of research gets produced on this topic primarily because everyone wants to figure out a brilliant technique for deriving SAR. I do it here because it shows similarity to the oil discovery problem. Interesting that after working out some simple probability equations describing the problem, I can came up with a very simple solution.
The species diversity follows the entroplet formulation for the probability density function:
D(x) = d/(d+x)2where x gives the relative abundance of a species and D(x) is the probability density function for this abundance. This shows many species of low relative abundance and progressively fewer species of high abundance.
The cumulative for finding any particular species within an area=A follows according to :
C(A=Area|x) = x*k*A /(1+x*k*A)
Arguably we could use a Poisson distribution (1-exp-xkA) but as we have little info on the boundaries of the area and the searching effectiveness, this formulation works well. Higher abundances will get accumulated more quickly, with the value k providing a cross-sectional efficiency that accommodates absolute densities.
Integrating this over all the species and their individual relative abundances:
Integral ( C(A|x) * D(x) ) dx =The value k*d mixes the entropic dispersion factor (d) with the cross-sectional capture efficiency (k), so we replace it with the combined density parameter P. For a specific plot of land, N gives the maximum count of species.
A*k*d/(1-A*k*d)2 * (A*k*d - 1 - ln(A*k*d))
S (A) = N * A*P/(1-A*P)2 * (A*P - 1 - ln(A*P))
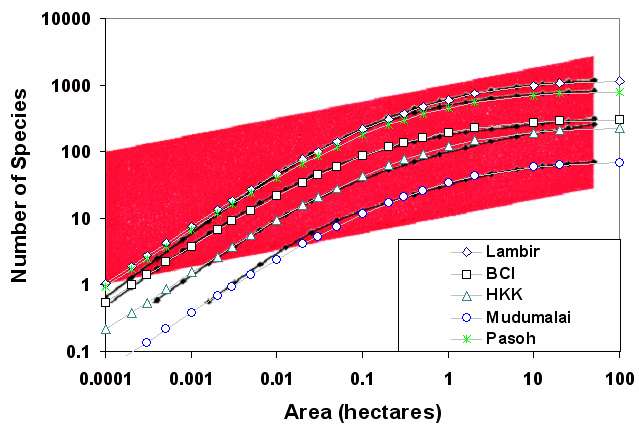
The figure plots the tree Species Area curves for 5 different tropical forested island or nature reserve regions. Note that each one of these curves has the single parameter P that describes the dispersion/areal density cross-section for a specific region's diversity. The value of N comes from the data table below. The black curves are data and the markers are my solution (the red region is the classic power-law region that has historically been used to describe the SAR)
| P | N | |
|---|---|---|
| Lambir, Malaysia | 1.1 | 1174 |
| Barro Colorado Island, Panama | 2.55 | 300 |
| Huai Khae Khaeng, Thailand | 1.15 | 231 |
| Mudumalai, India | 0.9 | 71 |
| Pasoh, Malaysia | 1.5 | 817 |
In this solution, I used the exact same mathematics that I derived for Dispersive Aggregation and Discovery of oil (per volume) as for counting trees on plots of land (per area). Don't forget that I plotted it as a log-log plot so that the agreement ranges over several orders of magnitude.
Update:
In my TOD post, Dispersion, Diversity, and Resilience, I have data for Pasoh and BCI on values of d derived from the Relative Abundance Distributions (RAD). RAD is a more fundamental measure than SAR, so we can cull out the dispersion factor nicely.
BCI: d = 23
Pasoh: d = 14
then from P=k*d, I get k=0.11 for each case, which means that the SAR model is entirely consistent with the RAD model for BCI and Pasoh.
This seems an incredibly important insight, if not for ecological modeling, then for the entire mathematical approach I am advocating, covering everything from oil discovery to earthquake statistics and on. The SAR and RAD models are simply subcategories of the entroplet approach and a simple application of the idea.
Refs:
posted by @whut at April 08, 2010
![]()
![]()


2 Comments:
You should check out my friend Lou Jost who is doing just this sort of fieldwork in Eastern Cordillera in Ecuador including species relationships and distributions;
http://www.loujost.com/
http://www.loujost.com/Statistics%20and%20Physics/Diversity%20and%20Similarity/How%20to%20compare%20the%20diversities%20of%20two%20communities.htm
Neat web site!
Everything about the earth and nature is fascinating and mysterious.
Post a Comment
<< Home