
Dispersive Discovery / Field Size convergence
 After having studied material nucleation and growth processes for a good portion of my grad school tenure, I think I can grasp some of the fundamentals that go into oil reservoir size distributions. I see many similarities between the two processes. For example, instead of individual atoms and molecules, we deal with quantities on the order of million-barrels-of-oil, yet the fundamental processes remain the same: diffusion, drift, conservation of matter, rate equations, etc. Deep physical processes go into the distribution of field sizes, yet I contend that some basic statistical ideas surrounding kinetic growth laws may prove more useful than understanding the fundamental physics of the process. To make the case even stronger, I use the same ideas from the model of Dispersive Discovery to show how the current distribution can arise; as humans sweep through a volume searching for oil, so too can oil diffuse or migrate to "discover" pockets that lead to larger reservoirs. The premise that varying rates of advance can disperse the ultimate observable measure leads to the distribution we see. For oil discovery, the amount gets dispersed with time, while with field sizes, the dispersion occurs with time as well, but we see the current density as a snapshot in a much slower glacially-paced geological time. For the latter, we will never see any changes in our lifetime, but much like tree rings and glacial cores can tell us about past Earth climates, the statistics of the size distribution can tell us about the past field size growth dynamics.
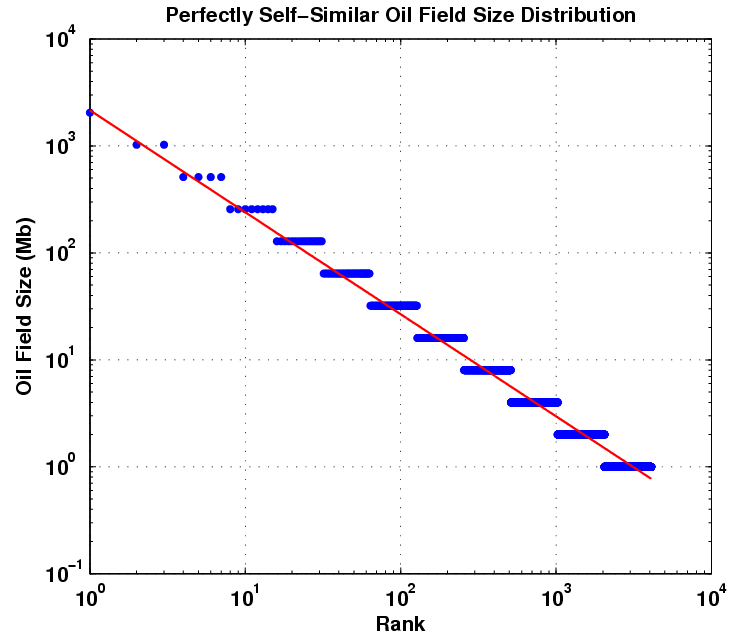
B. Michel provided a decent set of data for reservoir size distribution ranking of North Sea fields in his paper that I referenced here. Michel tried to make the point that the shape follows a Pareto distribution, which shows an inverse power law with size.

This kind of rank plot is easy to generate and shows the qualitative inverse power law, close to 1/Size in this case. The curve also displays some anomalies, primarily at the small field sizes portion and a bit at the large field sizes.
Khebab has some good background on the Pareto as well as the Parabolic Fractal Law described here. He also analyzed the log-normal used by USGS here. And he has some devised some case studies for Norway and Saudi Arabia.
 Neither the Pareto nor the Parabolic Fractal Law fit the extreme change of slope near the small field size region of the curve. The log-normal does better than this but does not universally get used (it also looks very well suited to small particle and aersol size distributions). The model I use seems to work better and it derives in a similar manner to the discovery process itself. If oil can tend to seek out itself or cluster via settling in low energy states and by increasing entropy via diffusing from regions of high concentration, this itself we can consider as a discovery process. So as an analogy I assume that oil can essentially "find" itself and thus pool up to some degree. By the same token, the ancient biological matter had a tendency to accumulate in a similar way. In any case, this process has taken place over the span of millions of years. After this "discovery" or aggregation takes place, the oil doesn't get extracted like it would in a human-accelerated discovery process but it gets stored in situ, ready to be rediscovered by humans. And of course consumed in a much shorter time than it took to generate!
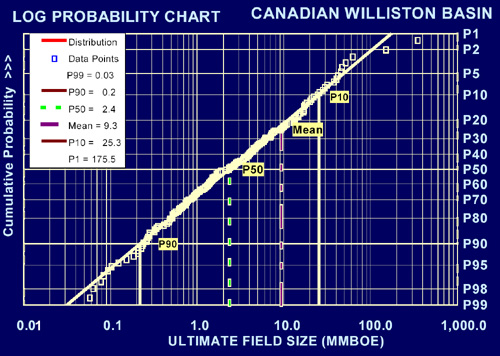
The following figure takes Michel's rank histogram and exchanges the axis to convert it into a regular (binned) histogram. The fitted curve assumes Dispersive Discovery via the Laplace transform of an exponentially distributed set of points. This differs from the reserve growth of discovery only in the sense that the cumulative starts from 100% instead of zero; in other words, in a region near the origin, just about all reservoirs reach at least this size. The curve essentially describes the line 1/(1+Size/20 Mb), where 20 Mb is the characteristic dispersion size derived from the original exponential distribution used. In the case of DD, 20 Mb becomes an average equivalent size that a columnar reserve growth discovery process would need to sweep through before significant discoveries would occur. For field sizes, we can use the same argument and equate this to a natural growth accumulation, where the average growth rate would start to see the effects of aggregation above the mean.

 damped exponential distribution |  clustered distribution after accumulation |
I can see another straight line through points which would give a slope of 1/Size0.96, but in general, for this region a single parameter controls the curvature via 1/(1+Size/20 Mb). If put into the context of a time-averaged rate, where the inflection point Size = k*Time = 20 Mb, where k is in terms of average amount migrated per geological time in a region, you can get a sense of how slow this migration is. If Time is set to 300 Million years, the constant k comes out to less than 1/10 barrel per year on average. The dispersion theory gives a range as a standard deviation of this same value, which means that the rates slow to an even more apparent crawl as well as speed up enough to contribute to the super-giant fields over the course of time.
Even though the approach relies on kinetic (not equilibrium) arguments, this works out as much by a conservation of mass argument as anything else. If a volume gets completely swept out, via diffusion and seepage, and all the oil in a region congregates, it becomes the biggest possible reservoir with a rank equal to 1. Yet, it has to equal the volume of the original distribution. The curve essentially shows cross-sections of the advancing mean at various stages of time, i.e. a moving finish line. So we assume that the last, rank=1, point is the finish line. Since the dispersion assumes a constant standard deviation relative to the mean, the stationary assumption implies that the rest of the distribution fractionally scales to match the extent of the fastest flow. So I have a feeling that this recasts the fractal argument, but only adding a starting exponential distribution which eliminates the pure 1/Size dependence of the fractal or Pareto distribution.

In a global context and given enough time, this simple kinetic flow model would eventually grow to such an extent that a single large reservoir would engulf the entire world's reserves. This does not happen however and since we deal with finite time, the curve drops off at the extreme of large reservoir sizes. We can't wait for an infinite amount of time so we have never and likely will never see the biggest reservoir sizes, Black Swan events notwithstanding. So if we extended the following figure to show 1/Size dependence over an infinite range, this would of course only hold true in an infinite universe. I can't tell because of the poor statistics we have to deal with, i.e. N=small, but the supergiants might just sit at the edge of the finite time we have to deal with.
What actually happens underground? Oil does move around through the processes of drift, diffusion, gravity drainage, bouyancy, and it does this at various rates. The reason that small particles, grains, and crystals show this same type of growth also has to do with a dispersion in growth rates. Initially, all bits of material start with a nucleating site, but due to varying environmental conditions, the speed of growth starts to disperse and we end up with a range of particle sizes after a given period of time. The size distribution of many small particles and few large ones will only occur if slow growers exponentially outnumber fast growers. The same thing must happen with oil reservoirs; only a few show a path that allows exteremely "fast" accumulation ( I say "fast" because this still occurs over millions of years). From the post on marathon results dispersion, it basically demonstrates the same intuitive behavior. Only the fastest of the dispersers will maximize the amount of ground covered (or material accumulated) in a certain period of time.

The reason I wouldn't use field size distribution arguments alone to estimate URR is because no "top" exists for the cumulative size, since we do not consider the size of the container that all the fields fit in to. The Dispersive Discovery model explicitly includes a URR-style limiting container, which makes it much more useful for extrapolating future reserves. I find it interesting though in how the two approaches complement each other. Dispersive Discovery only considers the size of the container, while Dispersive Growth figures out the distribution of sizes within the container. And as long as discoveries occur in a largely unordered fashion (I assert that large oil reserves are not necessarily always found first), using the Dispersive Discovery curve makes the analysis more straightforward (no matter what the USGS says).
Khebab and Laherrere make some good points concerning the Parabolic Fractal Law as some curves show significant "bending" as this size distribution from Mexico demonstrates:

So far the Dispersive Growth field size model uses a single parameter; I figure that I have another one to spare to explain Mexico.
posted by @whut at October 21, 2008
![]()
![]()


1 Comments:
Have to say that my research has generally pointed at a 'fill-to-spill' model - usually, all structures that can trap oil within a basin are filled to their point of structural closure.
A second point you may consider is that water movement underground may transport oxygen (or oxygenated species) and hence allow oil degredation at the base of accumulations. This wil degrade oil in proportion to the surface area, and hence oil accumulations below a certain size will tend to degrade to tar mats/nothing fairly rapidly, geologically speaking.
The top few fields will often be dominated by exceptional circumstances, of course (Cantarell being a classic example, IIRC it only exists because of a merorite impact, and should really be excluded from analysis on those grounds).
Post a Comment
<< Home