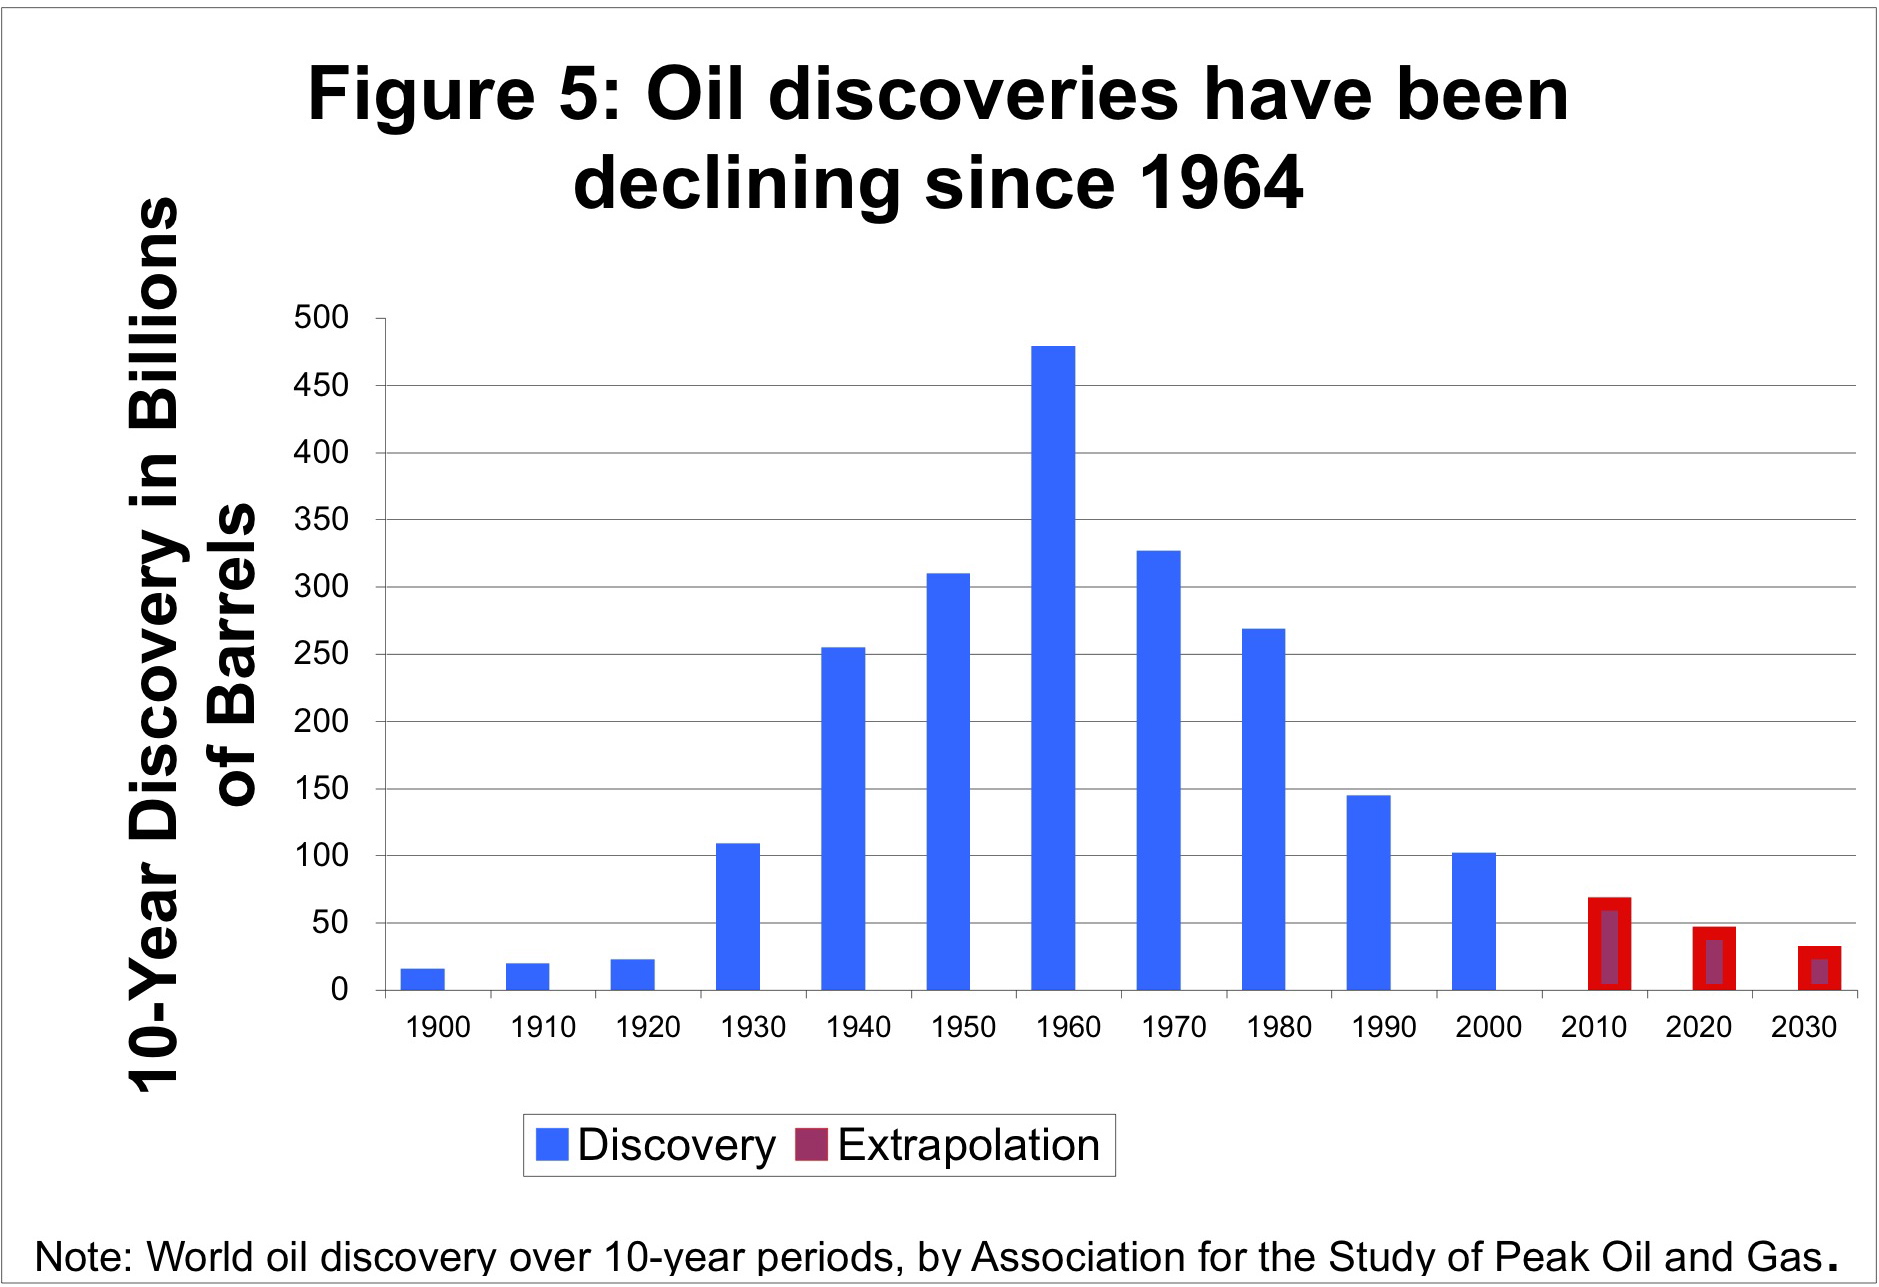
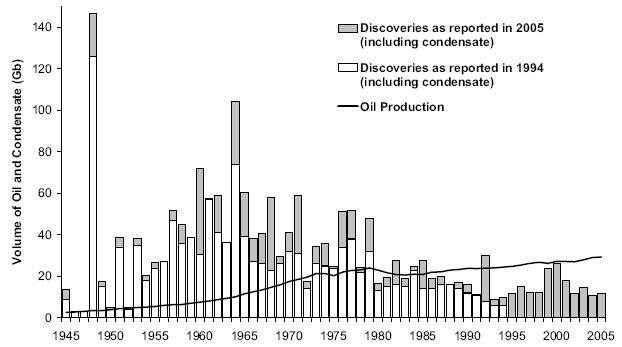
Discovery Curves
This from a recent "quiz" post on TOD:

This resurrected from a Rembrandt K post on TOD:

And this from a Khebab post on TOD:

And finally the classic reference profile:


The differences between these curves result primarily from different amounts of filtering. The top one appears to sum up cumulative in each decade, resulting in a more-or-less symmetric bias. However the second has a fairly severe lagged moving average, resulting in the discovery peak shifting right quite a bit. The third shows little by way of filtering and includes superimposed backdating results. The fourth has a 3-year moving average, which I believe came from the unfiltered fifth curve due to Laherrere. I haven't found where I dug up the last curve from.
I figure instead of filtering the data via moving averages, it might make more sense to combine discovery data from different sources and use that as a noise reduction/averaging technique. Ideally I would also like to use a cumulative but that suffers a bit from not having any pre-1900 discovery data.


7 Comments:
Excellent post, and one that goes straight to the center of some of the questions that have been bugging me since our conversation at this previous post, questions that were brought into sharp relief when I read the following quotes:
"The concepts of resources and reserves have historically created considerable misunderstanding in the minds of many nongeologists. Hubbert-type predictions of energy production assume that there is a finite supply of energy that is measurable; however, estimates of resources and reserves are inventories of the amounts of fossil fuel perceived to be available over some future period of time. As those resources/reserves are depleted over time, additional amounts of fossil fuels are inventoried.
"Throughout most of this century, for example, crude oil reserves in the US have represented a 10-14yr supply. For the last 50 years, resource crude oil estimates have represented about a 60-70yr supply for the US. Division of reserve or resource estimates by current or projected annual consumption therefore is circular in reasoning and can lead to highly erroneous conclusions."
Energy Resources - Cornucopia or Empty Barrel?
by Peter J. McCabe
U.S. Geological Survey
for The American Association of Petroleum Geologists
AAPG Bulletin, V. 82, No 11. November 1998, P.2110 - 2134
http://www.colorado.edu/Economics/vjcourses/resource/cornucopia.pdf
"The primary problem with a Hubbert-type analysis is that it requires an accurate estimate of the total resource endowment. Yet estimates of the total endowment have grown systematically larger for at least 50 years as technology has made it possible to exploit petroleum resources previously not considered economical. Hubbert-type analyses of oil production have systematically underestimated future oil production. This will continue to be the case until geologists can produce an accurate and stable estimate of the size of the total oil endowment.
Are We Running Out of Oil?
by David Deming
University of Oklahoma’s School of Geology and Geophysics
for NATIONAL CENTER FOR POLICY ANALYSIS
Policy Backgrounder, No. 159, January 29, 2003
http://www.ncpa.org/pub/bg/bg159/
These distinctly cornucopian (or at least anti-hubbert) arguments seem to boil down to roughly this line of reasoning:
The shape of the production curve is at the heart of the peak-oil debate,
but you can't talk about production without talking about discovery,
and you can't talk about discovery without talking about estimated reserves,
and you can't talk about reserves without talking about estimated total resource.
Which leads me to the conclusion that the source of much of the aforementioned "misunderstanding" is simply a definition of terms. The terms "discovery" and "ultimate reserves" are highly misleading because what they are describing is our best estimate of what we think we can get out of the ground, an estimate which is constantly changing, both upwards and downwards (although primarily upwards for the past few decades) and is quite distinct from how much of the total resource we think is actually in the Earth's crust (which I've seen estimated as high as 6 trillion barrels).
And so, speaking as a "nongeologist", I am beginning to think that a great deal of this confusion could be eliminated if someone much smarter than I am were to model at least four distinct variables:
1. What is the estimate of the total resource in the Earth's crust, and how does that estimate change over time?
2. What is the estimated percentage of that total resource that can be ultimately recovered, and how does that change over time?
3. What percentage of the total resource that can be ultimately recovered is realized as annual production, and how does that change over time?
4. What percentage of annual production is available as net production after the energy cost of production is subtracted, and how does that change over time? (EROEI)
And a possible fifth variable proposed recently as the export land model on TOD:
5. What percentage of net production is in excess of domestic consumption and is available as net export, and how does that change over time?
"Yes..., questions."
- Roy Batty from the movie Blade Runner
I am continually intrigued by your #1. It doesn't seem too hard to imagine that a known fractional volume of the earth's crust can possibly contain oil, and a fraction of that actually contains oil. Sweep that volume with ever increasing speed and efficiency and we have the discovery model.
#3 has to be a fixed fraction of reserve.
#3 has to be a fixed fraction of reserve.
Exactly. I believe you once described it as the "Markovian assumption that the rate of extraction is proportional to the amount left in the reservoir". I think I read somewhere that historically this has been something like 10%.
I understand the idea that in the shock model production follows from discovery data (after the various phases), but What I'm desperately trying to get my brain around is the weird notion that the discovery curve, at least as it is currently being used, is actually beside the point. Why? Here's my thinking so far:
- Discovery in it's most literal sense is "I drilled a hole in the ground and some oil came out".
- Therefore it would better be defined as "original reserve estimate".
- "Original reserve estimate" is constantly modified over time, typically as backdated reserve growth.
- This change can be modeled from year to year as a "current reserve estimate" curve. If I understand correctly you've already nailed this down as a self limiting parabolic growth.
- Remaining reserves are "current reserve estimate" minus production.
- Rate of extraction is then modeled as a fraction of the remaining reserves.
The implication being that the discovery model becomes an input to the "current reserve estimate" curve, and the discovery curve is replaced with a parabolic reserve estimate curve on a scale of trillions of barrels.
I know, being the technically illiterate boob that I am, I'm probably missing something obvious, but I wanted to throw that out there while the train of thought was still fresh.
The distinction between reserve growth and new discoveries is very fuzzy. On a local scale, reserve growth is associated with a particular known discovery. However, on a global scale, the connection seems more tenuous. Like you, this is rattling in my brain.
Exactly my point. The discovery data is only one input into the reserve estimate, the other being reserve growth (or reserve shrink, as the case may be), which makes comparing the discovery curve to the production curve meaningless. Much more to the point is a graph like this, and for people who still need to see the bell curve then a graph like this. But hey, what do I know? You're the expert.
Or, to put it another way, you don't need to make the distinction if discovery is just another form of reserve growth.
I would love to see graphs like the ones above for world reseves and production.
Oops, I probably should have looked at the first graph a little more closely. The Y axis would need to be trillions of barrels and not "amount", which would actually result in two sigmoids, one for reserves and one for production. Sorry for the confusion.
Post a Comment
<< Home