Volatility
We will have to get used to higher volatility of gas prices from here on out. Large fluctuations in the price of a constrained resource fall out naturally from even the simplest analysis of supply/demand curves from Econ 101.

When the resource becomes constrained, the supply curve goes more and more vertical, implying that the price a supplier will offer for a good only depends on demand -- the so-called inelastic regime.

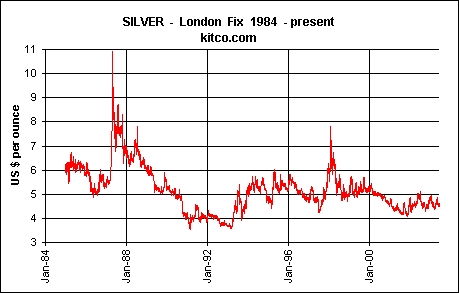
Any sensitivity analysis performed against Quantity will show the largest excursions when we have a vertical supply curve. Investors have known this behavior from markets such as precious metals for some time now.

The other part of the equation, speculation ala the futures market, will further exaggerate the effect. Those familiar with signal processing know that a derivative-based projection will only amplify any noise already inherent in the system.
But since most people have a patience horizon of a few days, they will treat this predictably unpredictable roller coaster as a chicken would a reflection of itself in the mirror every morning. At least the chicken has an excuse for its short term memory loss. Unfortunately, the citizens and politicians of our fine country who rejoice at the next drop in gas prices can only blame their own ignorance.
Supply/demand curves linked from the wikipedia entry.


2 Comments:
how can you post a silver chart that suggests that its current price is between $4 and $5? the point you were making is being made as well as ever right now, as we can see from a chart that actually runs through the present:
http://charts.barchart.com/chart.asp?sym=SIY0&size=D&sly=L&den=HIGH&data=G
How can you not realize that the chart I showed was a historical chart meant to show historical fluctuations in price? I do realize that a bunch of people reading this blog actually want to make money off of this stuff, but that isn't and never will be my goal.
Post a Comment
<< Home